In graphics: Youth unemployment worldwide

  • Published

Global youth unemployment rate

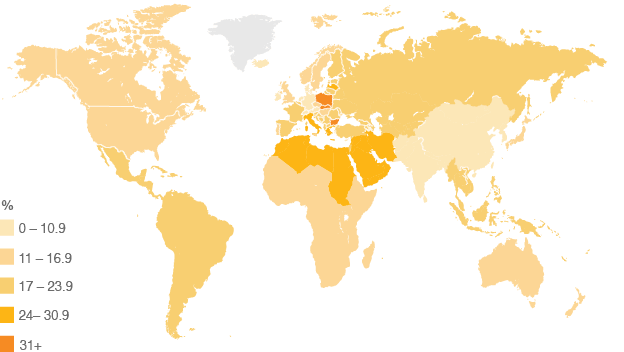
  • World map showing youth unemployment for 2002
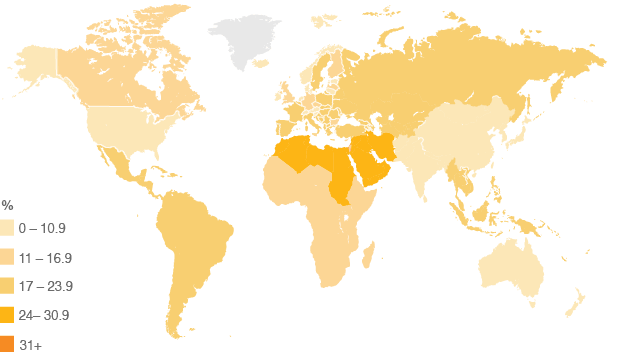
  • World map showing youth unemployment for 2007
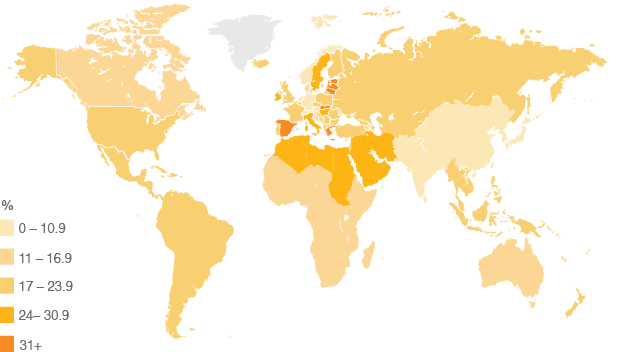
  • World map showing youth unemployment for 2010
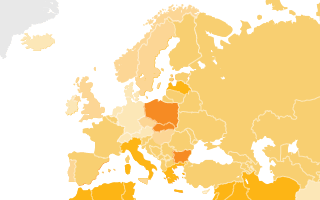
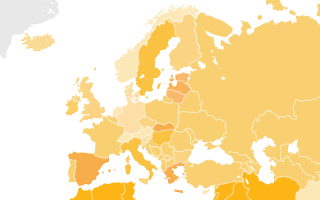
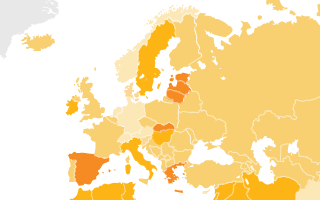
  • European map showing youth unemployment for 2002
  • European map showing youth unemployment for 2007
  • European map showing youth unemployment for 2010
All the figures come from the International Labour Organization (ILO), which provides figures for individual developed countries, and for groupings of countries in the rest of the world.

Global youth unemployment peaked at 13.2% in 2002, fell to 11.6% in 2007 and climbed back to 12.7% in 2010.

  • Graph showing youth unemployment between 1991 and 2011
  • Graph showing youth unemployment between 1991 and 2011
  • Graph showing youth unemployment between 1991 and 2011

Figures taken from the ILO report: Global employment trends for youth, external

Related internet links

The BBC is not responsible for the content of external sites.