Budget 2013: What the key numbers really mean
- Published

Another year, another Budget, another string of headlines and numbers.
Among this year's crop:
£3bn in new government investment spending
£11bn in under-spending by government departments
a 1p cut in beer tax and a cancelled 13p tax rise on fuel
funding for 15,000 new affordable homes
our national debt is to peak at 85.6% of GDP
the corporate tax rate is to fall to 20%
What do these numbers really mean? Find out below.
Infrastructure spending
The government said that it would increase capital spending by £3bn a year from the 2015-16 tax year.
In fact, this "increase" would actually mean locking in the government's annual rate of investment at the somewhat elevated 2014-15 level - which is expected to total about £50bn - instead of allowing investment spending to fall.
"Capital spending" is not necessarily the same thing as investment in new infrastructure - it also includes things like house-building, student loans and bank nationalisations.
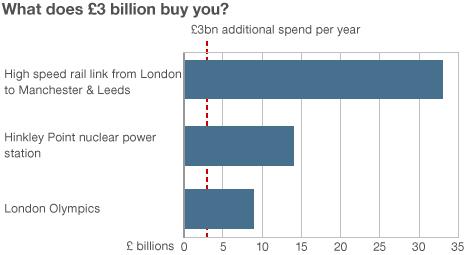
Assuming the extra £3bn per year does go on infrastructure, here is some perspective on what it could actually buy:
£33bn for the new high speed rail link from London to Manchester and Leeds, spread over 16 years (£2.1bn per year)
£14.8bn for Crossrail, external, over 10 years (£1.5bn per year)
£14bn for Hinkley Point nuclear power station, over eight years (£1.8bn per year)
£8.9bn for the London Olympics, over five-and-a-half years (£1.6bn per year) - including the cost of hosting the actual event
£250m for a waste incinerator, external in North Yorkshire

The £3bn is equivalent to 0.2% of the country's annual economic output, or £50 per person in the UK, and will be funded via additional spending cuts at government departments.
The chancellor did also announce in his Autumn Statement late last year £40bn in government guarantees, external for private sector infrastructure projects - although this will presumably be spread over the many years that qualifying projects take to complete.
Departmental under-spending
The Office for Budget Responsibility forecast that government departments would under-spend by £11bn this fiscal year (ending April 2013).
However, the OBR has suggested that at least some of this apparent under-spending may in reality be due to government departments postponing the payment for costs they have already incurred into the following financial year.
That £11bn is equivalent to 0.7% of GDP (gross domestic product, our annual economic output).
In comparison, the government's budget deficit in 2012-13 - which benefited from the under-spending - was estimated by the OBR to be 7.8% of GDP, down a whisker from 7.9% the year before.
Fuel and beer taxes
The chancellor announced tax cuts for both beer drinkers and drivers.
A planned rise in fuel tax was cancelled, meaning that petrol would be 13p per litre cheaper than otherwise.
That is equivalent to 10% of the current average price of a litre of standard unleaded, which is 139.9p this month according to data from the AA, external. About 58% of that price is already tax.
The chancellor claimed the typical Vauxhall Astra or a Ford Focus driver would pay £7 less to fill up the tank.
Mr Osborne also had good news for pub-owners. He cancelled future automatic tax rises for beer, and cut the current rate by 1p for a pint.
The average price of a pint in the UK is £3, according to the Good Pub Guide, external.
Including the now-cancelled 3p tax rise that was due to take place this year, that means a total saving of 1.3% on the price of a round - assuming pubs pass the benefit through.
Unsurprisingly, the change in fuel duty is by far the more expensive of the two giveaways for the exchequer.
It will cost the Treasury £480m in missed tax revenues in 2013-14, rising to £900m by 2017-18.
About 35 million people hold driving licences in the UK, so that is £13.70 per driver, rising to £25.70.
That total compares with a £200m annual cost for the chancellor's beer largesse, which works out at £4 per adult per year.
House-building
The chancellor unveiled various bits of new support for the housing sector.
The government will spend an extra £225m to get 15,000 affordable houses under construction in England (but apparently not the rest of the country) by 2015.

The Budget numbers add up to something meaningful for the home-building industry
The figure was described as a "drop in the ocean" by Richard Sexton of the chartered surveyors e.surv, who claimed 270,000 were needed.
Of more substantial help to the construction industry was the extension of the "Help to Buy" equity scheme, under which the government would lend buyers of new homes a 20% deposit on their purchase, provided they could put up a matching 5%.
That matches the 25% average deposit now faced by first-time buyers in the UK, although the scheme is actually open to all buyers and not just first-time buyers.
The government said the £3.5bn made available for the scheme would support up to 74,000 purchases over the next three years - implying an average price for a new home of £236,000.
There will also be a further £800m added to the oversubscribed Build to Rent fund, external, which provides loans for would-be landlords to buy newly-constructed housing.
Added together, the total amount made available in the Budget for purchases of newly-built homes comes to £4.5bn, spread out over three years. In comparison, new orders for the home-building industry in 2012 alone totalled £13.3bn - a figure well below its pre-crisis peak.
The financial markets certainly took the various figures well - share prices in Barratt and Taylor Wimpey rose more than 6% each on Budget Day.
The Help to Buy scheme also had a second leg - £12bn towards mortgage guarantees for buyers of both new and old homes - in other words it is not specifically targeted at the construction industry.
The government claimed this would support £130bn of lending, split over three years.
That compares with £143bn in gross lending in 2012, according to the Council for Mortgage Lenders, external - a figure little changed in four years, and far below its 2007 peak of £363bn.
Debt
The OBR again raised its forecast for the UK government's total indebtedness.
It now thinks the debt-load will peak at 85.6% of GDP in the 2016-17 tax year, instead of the previous guesstimate of 79.9% a year earlier.
It sounds a lot - almost an entire year's output of the UK economy. But it is nothing compared with the debts run up by war-time governments of the past - reaching some 225% of GDP in this country in 1945, and 260% by the end of the Napoleonic wars in 1816.
The current figure also does not compare so badly internationally.
It is somewhat above the European Union average, and about comparable with France.
Two separate and influential sets of economists (at the Bank for International Settlements, external, and at Harvard University, external) have claimed that when government debts rise above 85% or 90% of GDP, it causes serious problems for the economy - although other economists assert that the historic data supporting this claim is questionable, external.

We are not the only ones with rising debts over the coming years. The International Monetary Fund forecasts that by the end of 2017 countries such as France, Spain and the US will have similar net debt burdens to the UK, while the Japanese government's net debts will be double the UK's.
Like the US and Japan - and unlike the eurozone members today, or many developing countries in the past - virtually all of the UK's debts are denominated in our own currency, and only 17% is linked to inflation, all of which makes them much easier to repay.
Moreover, some £375bn of the government's debt - or about 24% of last year's GDP - is currently owed to the Bank of England, which has bought up the debts as part of its "quantitative easing" programme. If the Bank is treated as another branch of the public sector, in effect this is money the government owes itself.
The government is also benefiting from exceptionally low interest rates. The OBR expects the cost of interest payments to rise from 3% of GDP currently to 3.8% by 2017-18.
Corporation tax
The chancellor said that he would cut the UK's corporate tax rate to 20% by 2015, from its current 24%, making it "the lowest business tax of any major economy in the world".
This is the tax rate that companies pay on the profits they earn in the UK, and it is a hot topic in light of recent high-profile accusations of tax avoidance against various international companies, including Google, Amazon and Starbucks.
Below are a few international comparisons, courtesy of the accountancy firm KPMG, external. The worldwide average rate in 2013 incidentally is 24%.