UK energy mix: Where does our power come from?
- Published
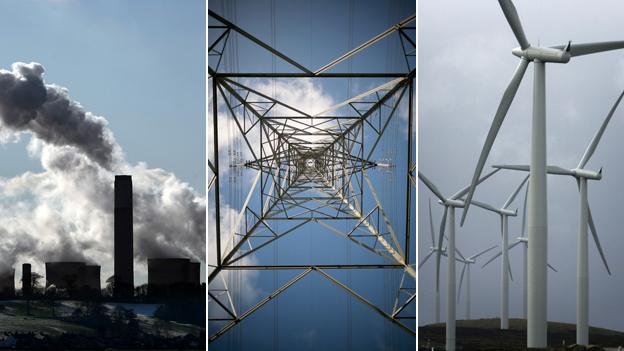
The UK's energy mix is set to change dramatically over the next 20 years
The energy we produce underpins pretty much everything we do.
Without it, there would be no artificial light, no long-distance communication, no mass transport or large-scale manufacturing. Facebook and Twitter would not even exist.
But how much of it do we use, and where does it come from?
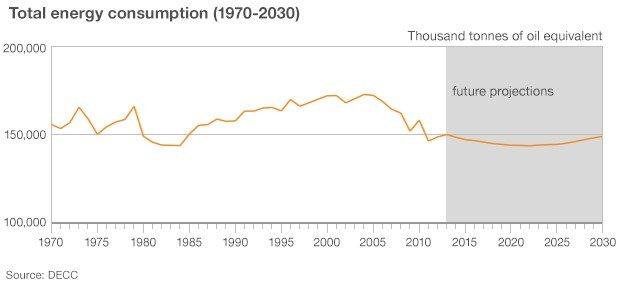
In fact, we consume less energy in the UK today than we did in 1970, and this despite an extra 6.5 million people living here.
The reason is very simple - we are more efficient both in producing energy and using it. The rise of the less energy-intensive service sector at the expense of industry has also played a part.
Households use 12% less, while industry uses a massive 60% less. This is largely offset by a 50% rise in energy use in the transport sector, due to the huge rise in the number of cars on the road - more than 27 million today compared with 10 million in 1970. The big increase in the number of flights is another important factor.
The Department of Energy and Climate Change (DECC) forecasts that energy efficiencies will continue to offset population growth, so that we will use about the same amount of energy in 2030 as we do today. In other words, the UK will use less energy in 2030 than it did in 1970.
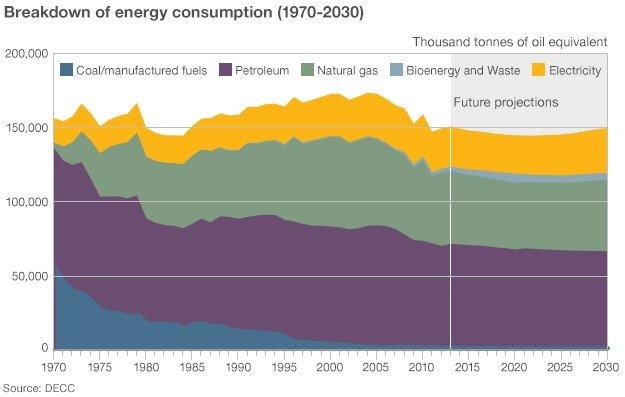
The major change in the make-up of our energy consumption is the rapid decline in the use of coal and fuels made from it, such as coke and blast furnace gas.
In 1970, we used almost 57 million tonnes of oil equivalent in coal and manufactured fuels. Last year, we used less than 3 million tonnes. Bear in mind, however, that we are talking here about the primary source of the energy we consume - coal, oil and gas are also used to generate electricity (see below).
The void left by the fall in coal use has been filled largely by a rapid rise in the use of natural gas and, to a lesser extent, an increase in electricity usage.
By contrast, the use of petrol has remained pretty consistent throughout.
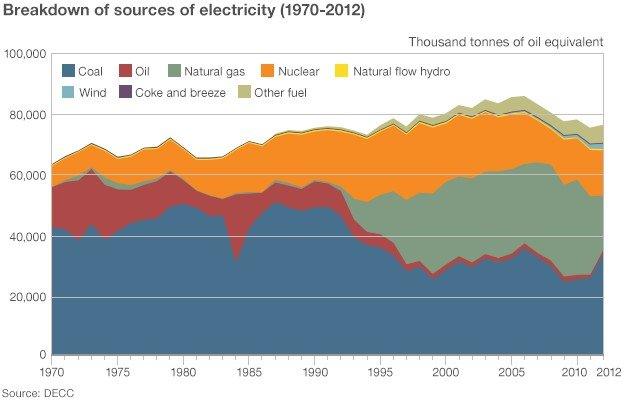
But to get a full picture of where all our power comes from, we also need to look at how electricity is generated.
And here the change in energy mix has been more dramatic. In 1970, coal accounted for about two-thirds of all electricity. Last year, it accounted for less than half, although for a number of years prior to that it made up one-third.
Apart from a sharp dip in the mid 1980s because of the miners' strike, coal use fell most dramatically during the 1990s. It has actually made something of a comeback in the past four years as the price has fallen, in part due to cheap imports from the US.
Oil use has also fallen sharply, from more than 13 million tonnes in 1970 to just 780,000 tonnes last year.
The big fall in coal and oil use in the 1990s was because of the so-called dash for gas, which was underpinned by cheap North Sea gas and the privatisation of the electricity market.
The eagle-eyed among you might notice the amount of electricity in the chart below is much greater than that shown in the chart above. This is because the chart below refers to the amount of primary energy sources that go into generating electricity, whereas the figures above represent final consumption.
For fossil fuels, the conversion efficiency of power stations is about 40%-65%, depending on the fuel type - in other words, only half the energy stored in the primary fuel ends up as electrical energy. On top of this, power stations consume some energy themselves, while more still is lost during transmission over the national grid.
Despite the recent resurgence of coal, DECC expects its use in electricity generation to fall sharply over the next 10 years.
But it does expect coal and gas-fired power stations fitted with carbon capture and storage (CCS) - designed to siphon off CO2 and bury it underground - to start producing electricity in 2017. Some would argue this is rather optimistic given the fact there are no large-scale, fully operational CCS stations in the UK.
In the short term, DECC believes natural gas and renewables - such as wind and solar - will take up the slack, with renewables taking an ever greater share over the next 20 years. By 2030, it expects renewables to be by far the biggest source of energy used in electricity generation, making up about 40% of the overall mix.
In the late 2020s, nuclear is also set to contribute more as the UK's new generation of nuclear power stations comes online.
So we may still be using the same amount of energy in 2030 as we were in 1970, but we'll be generating it in very different ways.
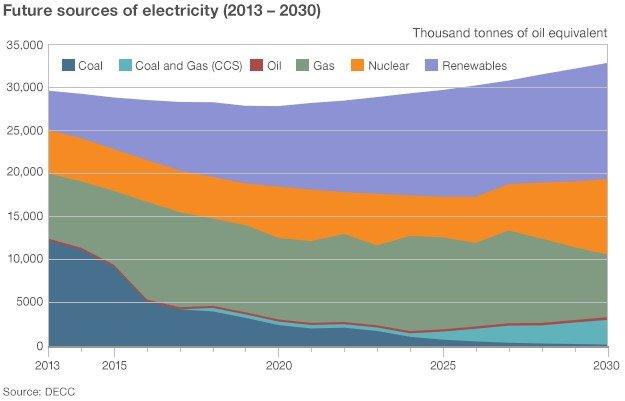
Again, you may notice the scale on the projections chart does not match that on the historical chart. This is because the former shows the volume of primary energy sources going into the power station, whereas the latter shows equivalent volumes coming out of the station. That's just the way DECC produces its figures.