Sixty years of spending: How the public purse has changed
- Published
As the details of Chancellor George Osborne's fifth Budget are still being digested, it seems timely to ask: what should the government be spending our taxes on? It's a question that has echoed through the centuries - with very different answers.
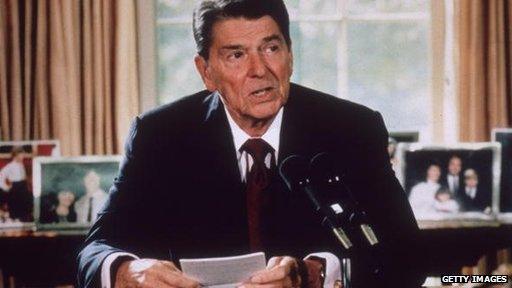
Former US President Ronald Reagan said: "No government ever voluntarily reduces itself in size. Government programmes, once launched, never disappear. Actually, a government bureau is the nearest thing to eternal life we'll ever see on this earth!"
As far as UK government spending goes, he was spot on.
As a proportion of our overall economy the amount the government spends hasn't changed all that much since the 1950s. It has stayed in the region of 42%-48% of our national income. But what it spends money on has changed dramatically. Politicians and voters in the 1950s would be astonished at today's priorities.
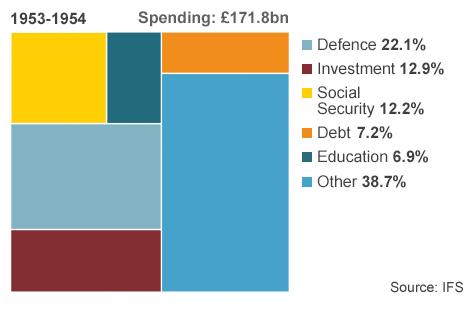
Just look at government spending for the financial year of 1953-54 - the year in which wartime rationing finally ended. The government spent 22% of its money on defence, compared with roughly half that on social security. Debt payments were also a large part of government spending as it paid the price for huge borrowing to finance World War Two.

Huge borrowing costs during World War Two meant debt repayments were high
Note also the biggest slice of all, the enigmatic "other", which represents spending on areas like local government, economic development and industry.
Moving forward a quarter of a century, to the dying days of the Callaghan Labour government and the face of spending has altered.
More data is available here so we're better able to break it down.
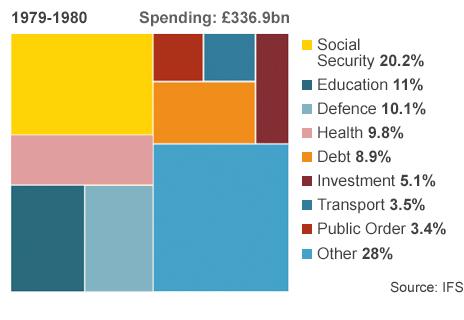
Debt has crept up and investment has come down as a percentage of government spending. Defence spending has been eaten away.
But the big change is a more interventionist, powerful government, with a well-established welfare state (a trend repeated all over the developed world). In other words government was simply doing more.
By the turn of the century, social security and health account for some 43% of government spending
Note that social security over a 25-year period has already shot up, gobbling up one-fifth of government spending.
By the turn of the new millennium, with party poppers exploding everywhere, the public finances continued their process of transformation.
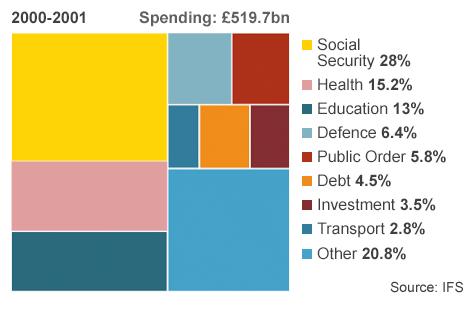
Twenty-one years on, even after the attempts by Margaret Thatcher to transform the state, social security and health have hugely increased their share, between them accounting for some 43% of all government spending.
To compensate, defence has been squeezed (although in real terms actual spending hasn't fallen that much, it has just lost its proportional share), so that it has nearly halved again.
By this time (after an extremely rare period of a government running a surplus and paying down Britain's debt stock) debt payments have gone down too, to 4.5% of spending (down some £8bn a year from the late 70s).
The last complete set of data we have is for the financial year 2012-13.
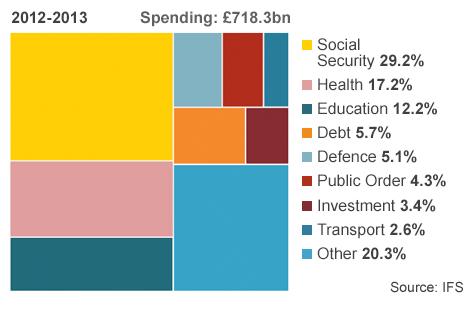
It shows that we've come a long way since the early "austerity" 1950s. Though both are eras marked by relatively tight public and private spending growth, the stuff that our government spends money on is really very starkly different.
Defence spending has plummeted to 5.1% of our national income and we now have more admirals than major ships.
In contrast health and social security account for nearly half of all government spending, something politicians some 50 years ago would probably have found altogether incredible (indeed it was a commonplace view that health spending would shrink over time as people became healthier).
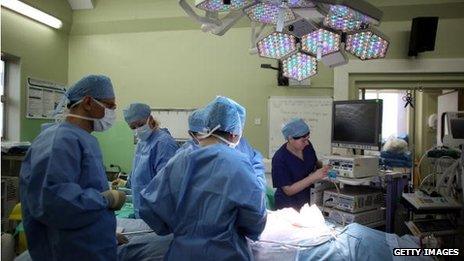
Health is one of the areas to have seen a big rise in spending
In real terms, by comparison with the early 50s, social security has enjoyed a 14-fold increase in spending. Note too that the "other" is much smaller than it was.
Partly this is because we can break the data down into more discrete categories but partly it's because government has prioritised - as costs on pensions, health and education have gradually increased, everything else has reduced (or in some cases disappeared altogether, for example total government subsidy of higher education).

The increasing cost of pensions is the biggest part of increased social security spending
As both parties are now signed up to some form of budget balance total expenditure, a rapid increase in spending looks unlikely.
However even greater pressure will be brought to bear on resources. By 2017-18 social security spending (mainly as a result of pensions) is projected to be £8bn higher than it is now.
The same is true of debt interest payments, as the heavy cost of the huge borrowing the country has undertaken since 2008 really starts to bite, rising by 34% by 2017-18 compared with today (or by £14bn a year).
This pressure and the unwillingness to raise direct taxes explain why the influential think-tank, the Institute for Fiscal Studies, project that the government's current plans imply a cut of one-third to departments that haven't been ring-fenced (that is everything apart from the NHS, education and foreign aid).
As director Paul Johnson has said, these cuts will not only "result in extraordinary levels of cuts across public services, they'll also change very dramatically the shape of the state that is delivering them."
A state that has already changed dramatically over the past 60 years.