Reality check: How big is the UK's deficit and debt?
- Published

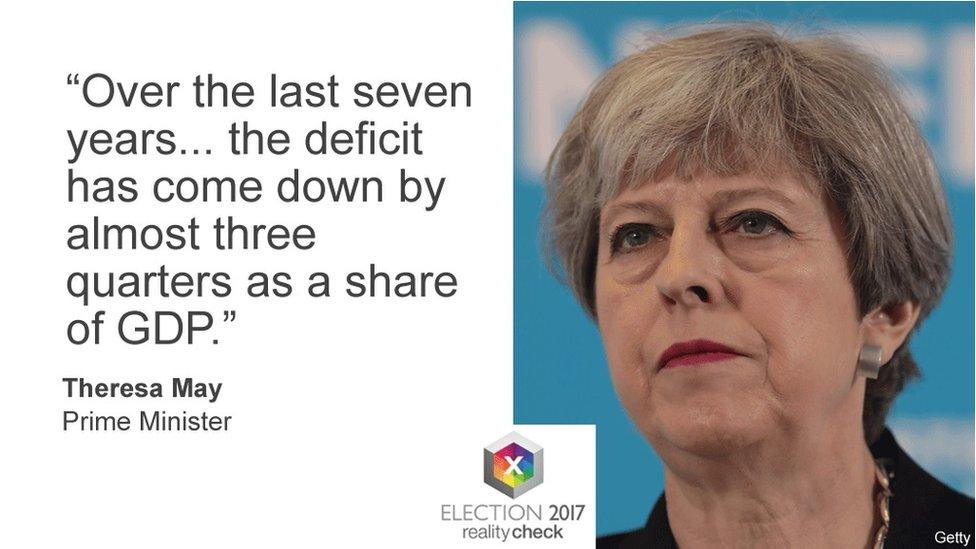
The claim: Prime Minister Theresa May said that the Conservatives had, over the past seven years, cut the nation's deficit as a share of GDP by almost three-quarters.
Reality Check verdict: The amount being borrowed each year has been reduced from 9.9% of GDP when the coalition government took power in 2010 to 2.6% of GDP in 2016 under the Conservative government, a reduction of almost three-quarters. But while the amount being borrowed each year has been falling, the overall debt is still rising.
Prime Minister Theresa May said that Conservative-led governments had dramatically reduced the deficit since 2010.
At a news conference on Wednesday she said: "Over the last seven years... we have taken the British economy out of the danger zone. The deficit has come down by almost three-quarters as a share of GDP."
To examine that claim let's first clear up what we are actually talking about.
Deficit
This is the difference between the amount the government spends and how much it receives in taxes and other income.
If the government spends more than it takes in, then it's in deficit. If it receives more than it spends, it's in surplus.
Every month the Office for National Statistics (ONS) measures the deficit using a specific figure: public sector net borrowing.
That might sound technical, but it's just how much the government has borrowed to cover its shortfall, minus items like cash and other liquid assets.
Importantly the figure excludes borrowing by Royal Bank of Scotland, which is 73% owned by the government.
That is such a huge number that it would dominate the figures if it was included.
Debt
So what happens when the government spends more than it takes in?
Well, it borrows and that borrowing is added to the overall debt pile.
The accepted and widely used figure for debt is actually the net debt of the UK; in other words, the total debt minus the government's liquid assets.
An easy way to compare debt levels across different countries is to express debt as a percentage of total economic output, or GDP, which is why you'll hear commentators talk about the debt-to-GDP ratio.
The government can't start cutting the debt pile until it starts running a surplus, which means eliminating that pesky deficit.
So what's been happening to the deficit?
In 2010 when the coalition government took over, the new chief secretary to the Treasury was famously left a note, external by his predecessor.
"I'm afraid there is no money," it read.
And he wasn't joking.
The UK was hit by recession in 2008 following the financial crisis, and to cover its outgoings the government had to borrow a record £154bn in 2009.
By the time the coalition took over in 2010 that had fallen slightly to £144bn, equivalent to 9.9% of GDP.
The new Chancellor of the Exchequer, George Osborne, announced an austerity package of tax rises and swingeing spending cuts in his June 2010 budget.
He vowed to balance Britain's books within five years - a promise that was to cause him a lot of trouble.
While the deficit did fall by almost half by 2015, it was still nearly £80bn for the year.
Philip Hammond took over as chancellor in 2016 and has seen the deficit fall further.
For the financial year to the end of March 2017, the deficit was £52bn or 2.6% of GDP.
Mr Hammond has not set a hard deadline for when that will be reduced to zero.
Instead, in their 2017 manifesto, the Conservatives pledged to eliminate the deficit by the "middle of the next decade".
Where have the austerity measures fallen?
As the chart above shows, austerity measures since 2010 have not fallen evenly on government departments.
The hefty cuts have fallen on transport, work and pensions and local government and they can expect further cuts over the next few years.
Hang on! What about debt?
As the chart above shows, before the financial crisis, debt as a percentage of the economy was less than 40%.
But when the 2008 recession hit, the government borrowed heavily and debt increased dramatically.
The Office for Budget Responsibility expects debt as a percentage of national income to peak in the current financial year at 88%, the highest level since 1966.
The UK has the sixth-largest government debt of advanced economies.
To start cutting that debt to GDP ratio the government needs to start running a surplus or the economy needs to start growing more quickly.
This report was updated on 18 May 2017 to reflect the Conservative Party Manifesto.


