Economic growth: Five charts that matter
- Published
- comments
Most economists predict the Office for National Statistics will announce on Wednesday that the UK economy expanded by about 0.3% in the third quarter of the year.
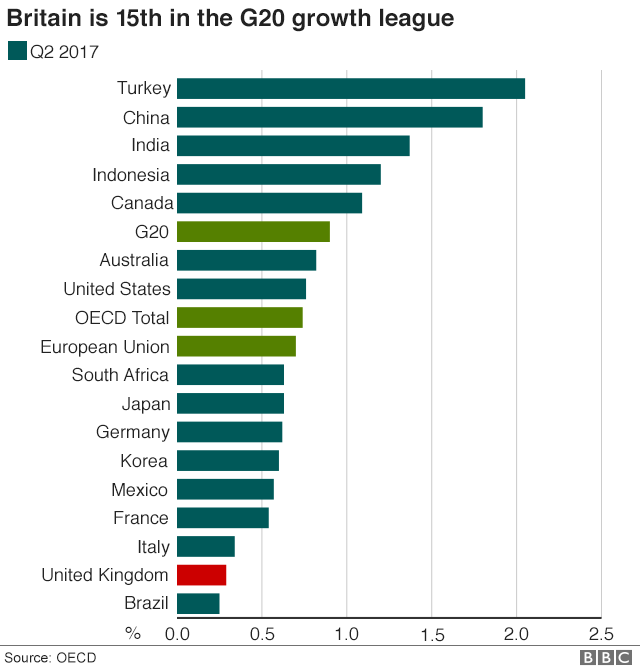
Such a modest figure will do little to change our relatively lowly position in the growth league table of the 20 leading industrialised nations.
The UK is 15th, with only Brazil performing more weakly in the second quarter from April to June.
It will be the final growth figure (except for the usual revisions) published before Philip Hammond delivers his Budget next month.
And it reveals the constrained circumstances the chancellor is facing.
From growth, all else follows - jobs, our personal incomes, tax revenues and the ability to pay for public services like health and education.
Without growth, the government's calculations on whether it is able to "ease austerity" become harder to the point of impossible.
Recessionary plunge
If we look at the quarterly growth figures back to 2000 it is clear where the big shock lies.
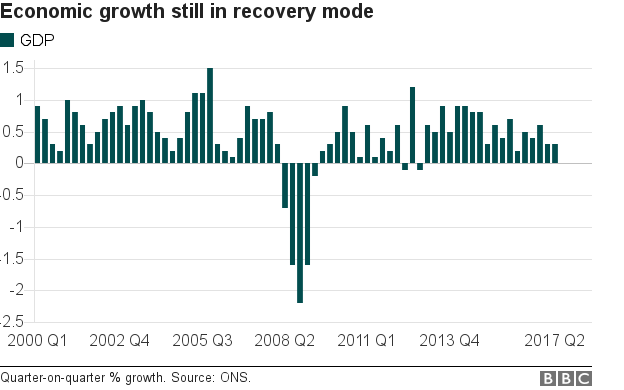
It is not the Brexit referendum, it is that period between 2007-2009 when the financial crisis and the drying up of bank liquidity (readily available finance to support businesses and economic expansion) led to a recessionary plunge.
Since then growth has limped back into positive territory, but the economic motor so damaged by the credit crunch has never really recovered.
Brexit has added to fears that economic growth is suffering - and there is evidence that uncertainty is affecting investment decisions.
But the foundations of the problem go far deeper than the referendum result.
Let's start with the lack of a robust recovery. That has had a brutal effect on people's incomes.
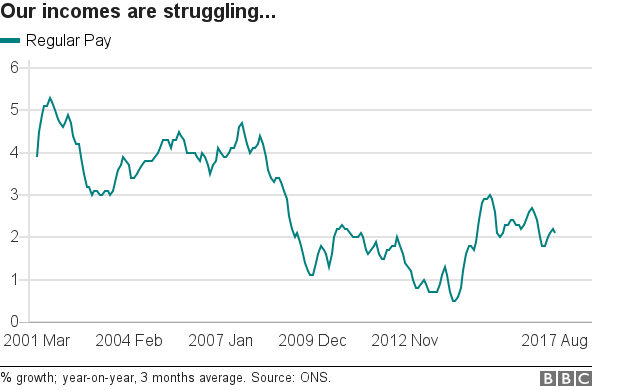
It is remarkable to note that at the beginning of the century average wage growth was above 5%.
It is now struggling at around 2%, below the rate of inflation (price rises), meaning that in real terms people's incomes are falling, as they have been for the majority of the time since the financial crisis.
Yes, employment rates are high - which is a tremendous economic good (being in work is one of the most important markers of economic well-being) - but wage growth has not followed.
Why? Well, the answer to that is contained in our fourth chart - productivity, the ability of the economy to produce more for every hour worked.
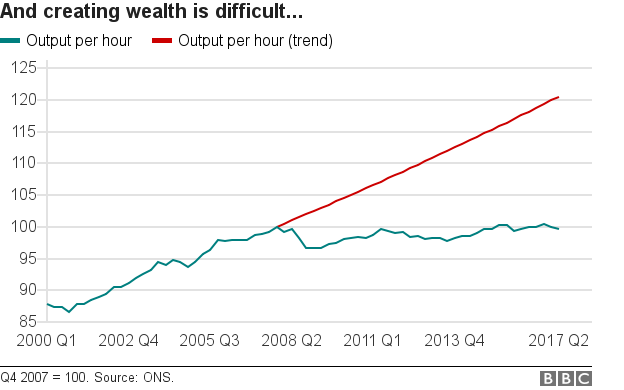
Here, we can see that rates are still slightly below the levels we were achieving in 2007.
And we are nowhere near hitting the historic trend productivity growth rate - the red line - which would have seen productivity 17% above where it presently rests.
Wealth produced per hour has not budged - making wage increases harder to fund.
Add that to the mix of uncertainty and fears that lagging growth is going to get worse before it gets better and it becomes easier to understand why real wage growth is negative.
The private sector is nervous about loosening the purse strings.
And the public sector is still subject to a 1% pay freeze.
Benefits, which support lots of people in work, are also frozen, meaning that the automatic stabilizers which are supposed to kick in when the economy is weak (increased benefit payments) cannot function as shock absorbers.
And from that confluence of factors it is a relatively short hop to the final chart, consumer confidence.
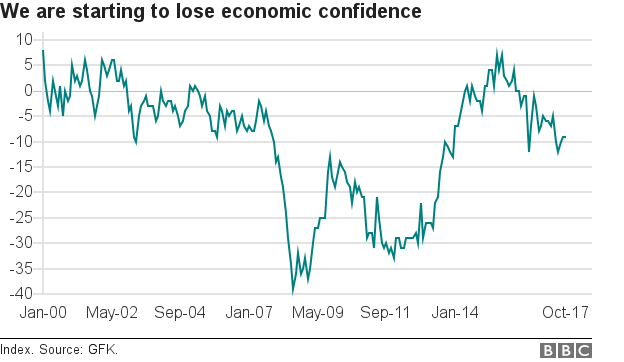
Admittedly, this is a pretty volatile measure.
But the trend over recent months is clear. As the incomes squeeze continues, people's optimism about the future and the ability to balance the household finances wanes.
If that softer confidence starts being reflected in spending habits then that creates a reinforcing negative loop for economic growth.
Household expenditure accounts for about 60% of UK economic activity.
And household spending growth in the second three months of the year has already shown signs of a slowdown and, at 0.1%, is only just in positive territory.
There are some reasons to be positive about the year ahead.
Inflation is likely to fall as the effects of the post-referendum fall in the value of sterling drop out of the annual data. And wage growth is predicted to rise.
But these are small-scale moves compared with the big trends of low growth and low productivity.
Unless the Chancellor feels confident that those trends can be reversed, then his room for manoeuvre on Budget Day - November 22 - will be severely constrained.
Whatever the state of the Brexit negotiations.
Charts compiled by Daniele Palumbo
- Published18 October 2017
- Published16 October 2017

- Published16 October 2017

- Published26 June 2017
