Academy chains v local authorities
- Published

In the past few years, a major innovation in education has been the growth of the academy chains - charities who run strings of state schools. But, so far, there have only been sporadic attempts to benchmark how good the new providers are, especially when compared to local authorities.
Happily, the government is now trying - and their first analysis shows some important results. In fact, new research, external by the Department for Education has cast a little doubt on this policy.
This kind of assessment is tricky: academy chains tend to take on local authority schools that are performing below the expected level, even when you take their challenging circumstances into account. So results will be poor when they start, but it should be easier to improve them rapidly.
How exactly do you make metrics that take the low starting point and the fast potential improvement into account? The DfE has come up with two experimental measures that seek to do that, and it has calculated them for 100 local authorities and 19 big academy providers.
First, they have calculated a value-added "performance" score. Schools are given more points if their pupils beat pupils who did similarly well in tests when they were at primary schools. Schools that have been in a chain longer are given more weight to reflect the chain's contribution to results.
Second, they have calculated a measure of how fast the school chain is improving compared to schools with a similar value-added performance at a moment in the past. The "improvement" score, therefore, is measured against schools which had similar capacity for easy catch-up gains.
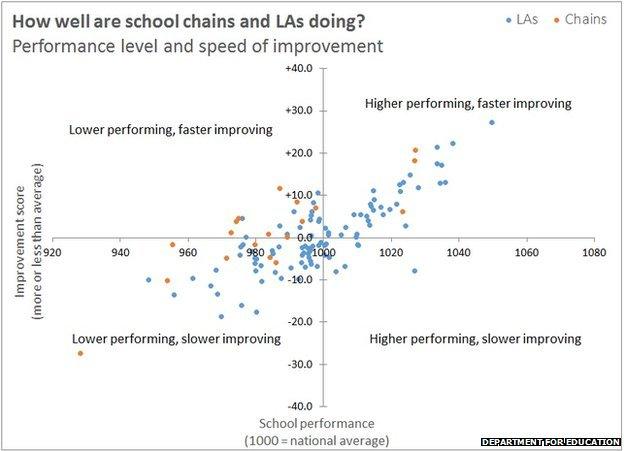
The official rubric says that you can't compare local authorities and chains, but that's a politician's plea rather than a statistician's warning. You can ignore it. And this is the graph you get when you fling them together. The orange dots are academy chains and the blue dots are local authorities.

From left to right, we are measuring the schools' current performance. A score of more than 1,000 - a dot on the right of the graph - would mean a school where the results were better than the national average once you have taken the pupils' prior academic records into account.
Looking up and down, we are measuring school improvement under their current management compared to schools that were of similar quality. A score of more than zero - above the horizontal line - means the school group has improved faster than previously similar schools.
Staying mindful of statistical significance, a few things jump out.
First, note the two orange dots together up at the top right - Ark Schools and the Harris Federation. That's in the quadrant where school groups do better than average and improve faster than average.
Those two chains have improved progress by the equivalent of an extra three GCSE grades in one subject in each year that they have run the schools, compared to schools that were in a similar state. That's brilliant performance.
They are joined in that quadrant by the Diocese of Westminster, another academy sponsor. But note that they are beaten by some local authorities - the blue dots above them and out to their right. Hackney, Barnet and Haringey beat all comers on all measures.
Like Ark, Harris and the diocese, these LAs have ridden the London wave: the capital has tended to do well, pulling away from the rest. There are other interesting improvers - like Portsmouth and Manchester - but they start a little way back on overall performance.
Second, at the far opposite end of the spectrum, the University of Chester Academy Trust - a chain - is running poor schools that have been losing ground. It is in the bottom left quadrant, so is weaker than average and not gaining on the average. It is one of the two academy chains that is significantly worse than the national average when it comes to the speed of improvement.
The remaining 12 chains in the study are roughly at the national average for speed of improvement, once you take into account how well the schools were doing when they took them over. Most academy chains. it turns out, are not Ark, Harris and the Diocese of Westminster.
Indeed, only Ark, Harris and the Diocese of Westminster have reached a level of better-than-average results for performance, once you account for pupils' prior academic results.
This is all very important: previous research found that the early academies, which seeded some of these chains, were good at school turnaround. Handing LA schools to academy chains is still the government's main tool for low performance.
This analysis is awkward for local government, too. Newcastle, Blackpool, Stoke, Barnsley, Bradford, Oldham, the Wirral, Liverpool, St Helens and Redcar are both weak and falling back. It is important for social mobility, in particular, that we have a strategy to make them better.
But this research suggests it will need to be more than "call in the academies". These new metrics are experimental, and under consultation. Maybe the precise findings will shift a little. But the overall picture conforms with other researchers' findings: it's not clear how much capacity the academy chains have to hammer up results, even if the early ones were a success.
One thing that has emerged from thoughtful education writers, external in recent months has been a concern that we need more "capacity building".
That means the nuts and bolts of how schools work and how they are managed. Rather than changing who runs schools mechanically when schools are troubled, perhaps we need to think more about why Manchester is getting better while Liverpool isn't. And the answers will be dry and technical.
This isn't the stuff of great rhetoric. But let the politicians worry about that. What's really important is that we find out how we can make all school providers as good as Ark or Hackney, whatever sort of school provider they are.