Secondary tables - poor pupils behind for next 70 years
- Published
- comments

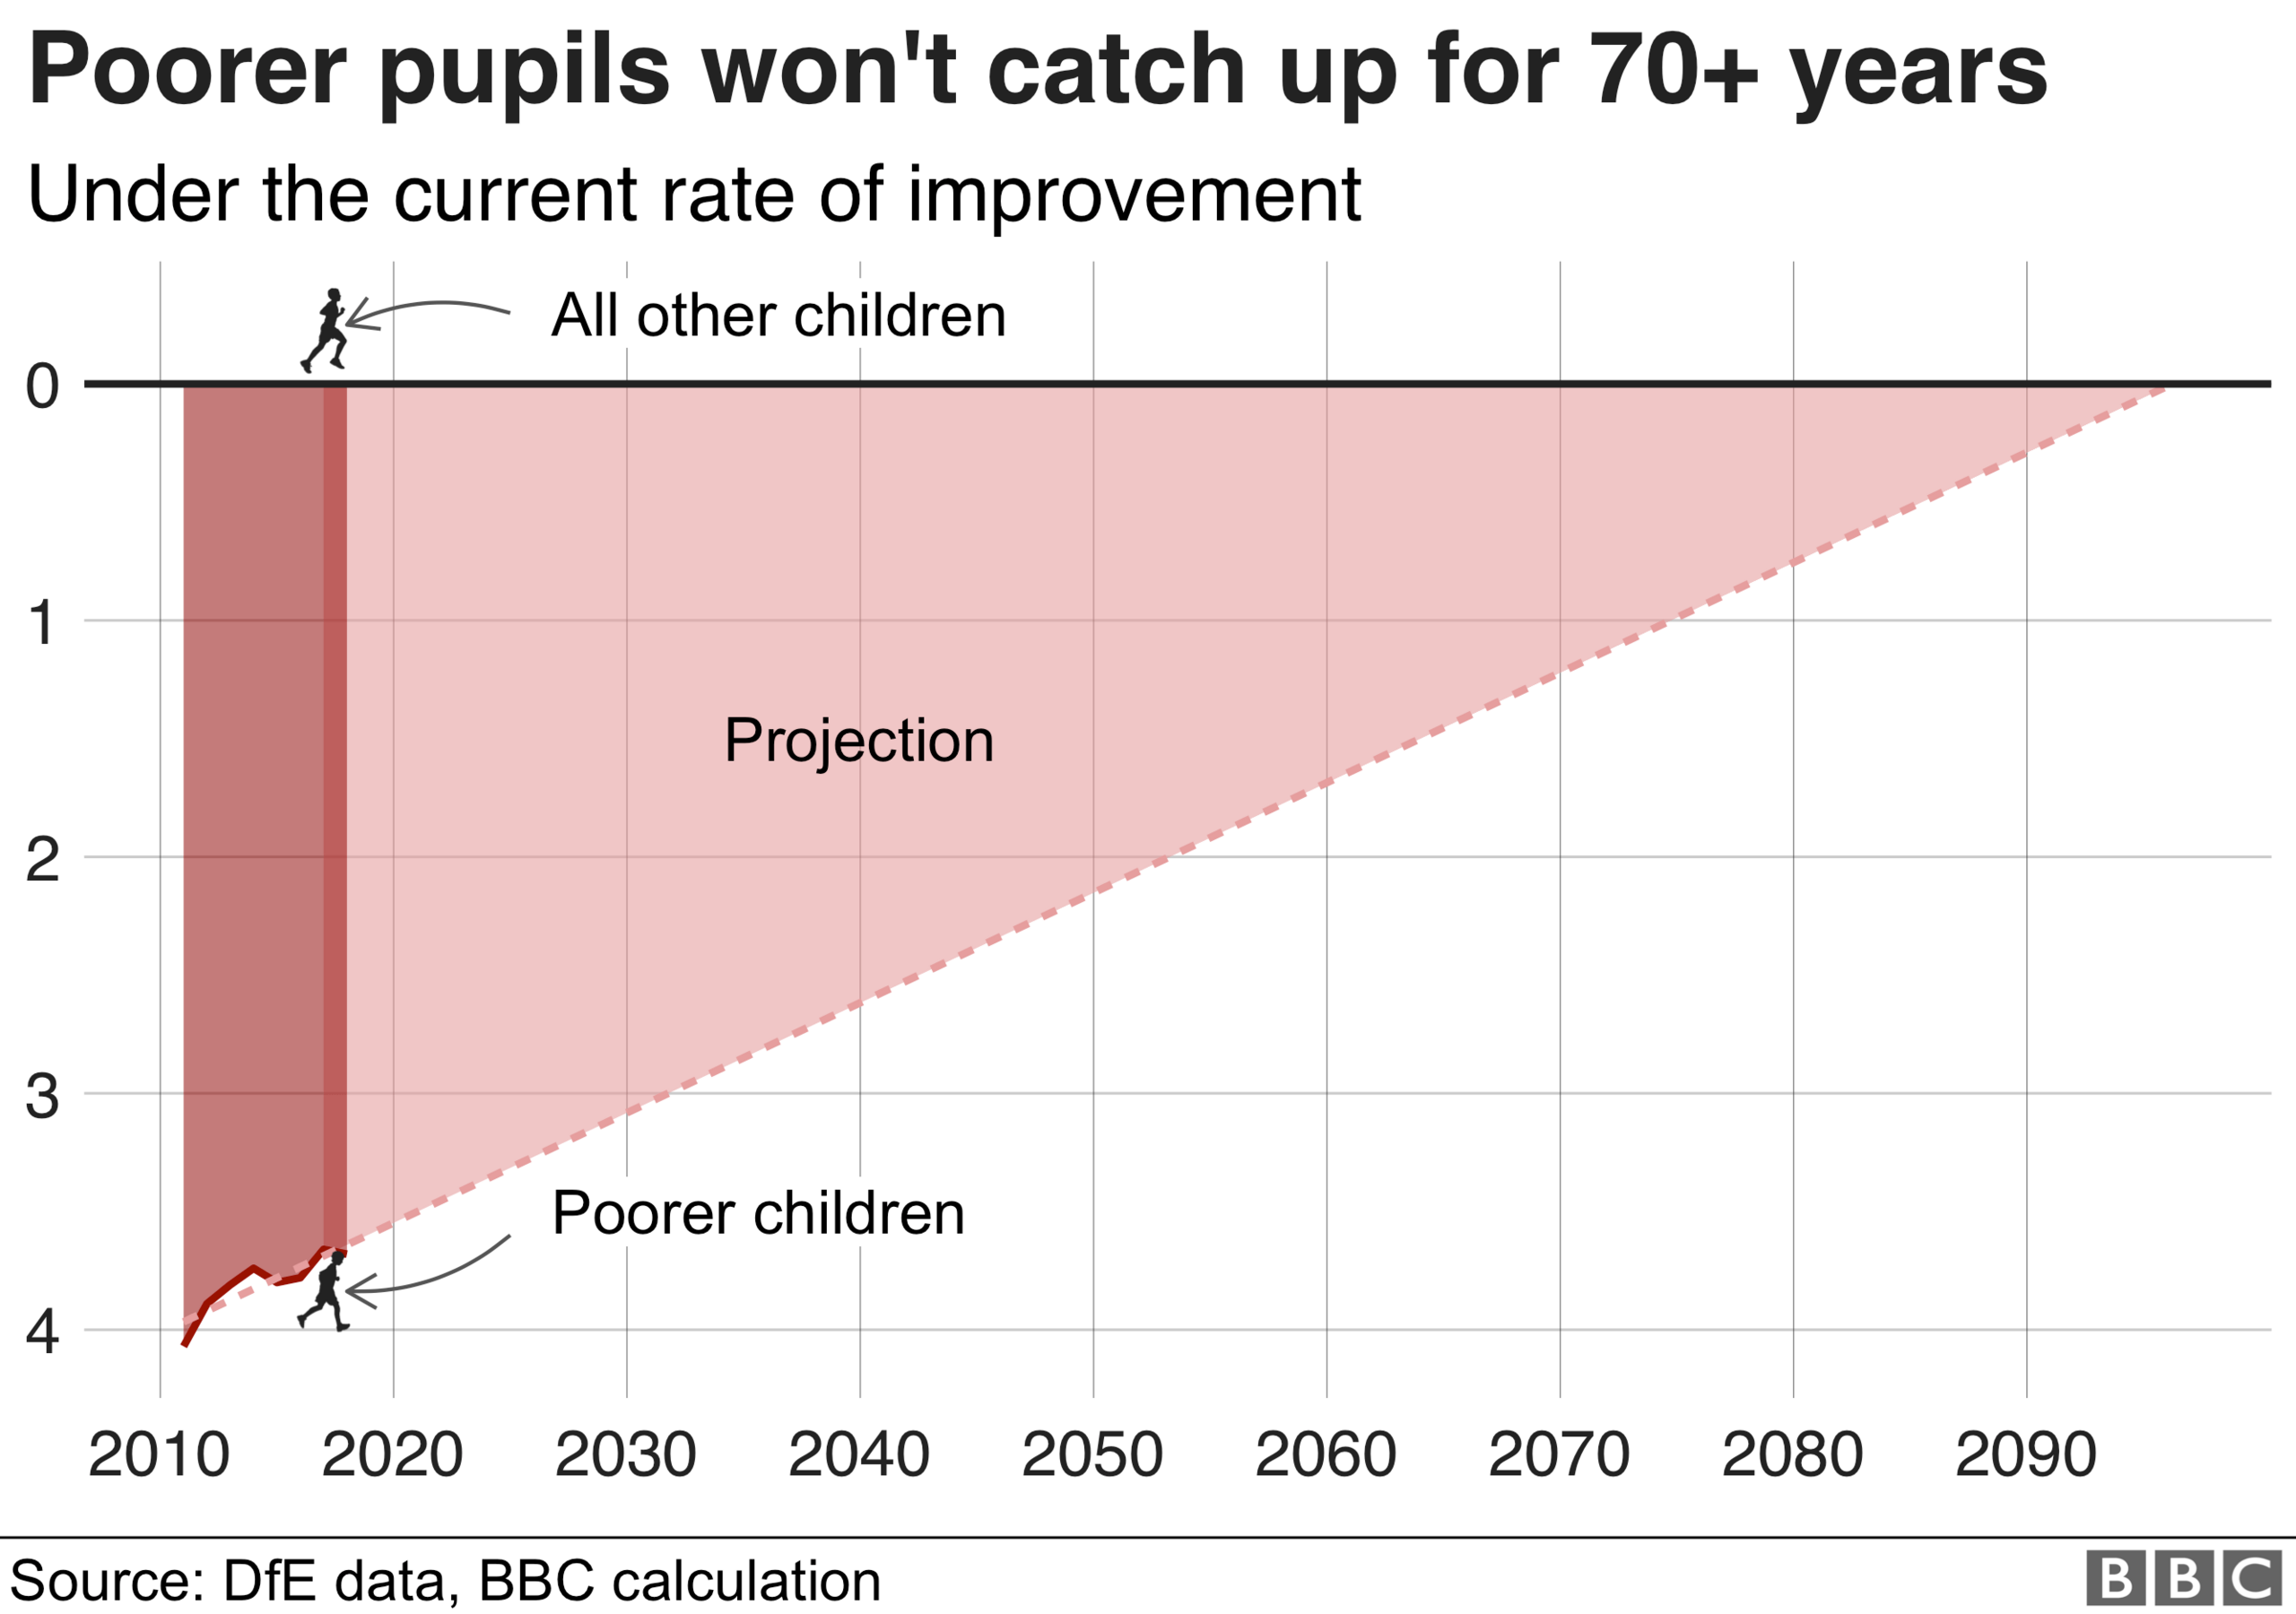
As secondary school tables are published, BBC analysis shows it will take over 70 years for poorer pupils to catch up with their peers at GCSE.
If the pace of change remains the same as it has been since 2011, poor pupils will not do as well until the 2090s.
The data shows the achievement between the poorest pupils in England and their classmates is closing but very slowly.
This year, 24.9% of the poorest pupils got good passes in English and maths GCSE, compared with 50.1% of the rest.
The league tables give national data, as well as details of how each school has performed.
Readers can check how schools in their area have performed through the BBC's postcode search below.
If you can't see the postcode lookup, click or tap here, external.
The disadvantage gap has shrunk almost every year since 2011 but at a slow pace.

To assess this gap, the government uses GCSE results in English and maths.
The results of pupils classed as the most disadvantaged are compared with the results of all the other pupils.
Children are counted as disadvantaged if they are eligible for the pupil premium, that is if they have been eligible for free school meals at any point during the past six years or have been in care continuously for at least six months.
The government ranks all GCSE pupils from best to worst as if they were the results of a race.
On average, poorer pupils rank worse. This difference in average ranking between poorer and better-off children is the disadvantage gap.
In 2011, the gap was four places, meaning that poorer children would sit about four places further back on average in a ranking of 20 poorer and 20 better-off children.
This year, it is down to 3.68 places - a very small change over a seven-year period.
Are poorer children being left behind? Race explains how they are put at a disadvantage
School Standards Minister Nick Gibb said making sure that all pupils, regardless of their background, were able to fulfil their potential was one of this government's key priorities and these results showed more pupils across the country were doing just that.
"It's been clear for some time that standards are rising in our schools and today's data underlines the role academies and free schools are playing in that improvement, with progress above the national average and impressive outcomes for disadvantaged pupils," he said.
But Geoff Barton, general secretary of the Association of School and College Leaders, said while schools were working incredibly hard to close the attainment gap between disadvantaged pupils and others, they could not do this alone.
"We need joined-up social and economic policies which restore hope and aspiration to blighted communities and which provide the support for families and young people which has been eroded in recent years by public sector cutbacks.

"To make matters worse, the level of funding for schools is totally inadequate and this hampers their ability to provide additional support to the most vulnerable learners.
"It is absolutely vital that the government improves the level of school and college funding as a matter of urgency if it wants to turn its rhetoric of improved social mobility into reality."
What happens elsewhere in the UK?
Data on how well Scottish pupils do in reading, writing and numeracy is published as part of its Curriculum for Excellence.
The Welsh Assembly publishes school performance information in the form of a colour code. Schools are rated green, yellow, amber or red, according to how well they are performing.
School league tables are not published in Northern Ireland.
- Published6 February 2020
