Poverty tightens grip on poorest children, research says
- Published
- comments

Child poverty is tightening its grip on Britain's poorest families, research suggests.
About two-thirds of children are living in poverty-hit families in pockets of some large cities, the study for End Child Poverty Coalition estimates.
More than half of children in over 200 wards are below the poverty line, statistical analysis of official indices of poverty shows.
The coalition of poverty charities says whole areas are abandoned to poverty.
The research, carried out by Prof Donald Hirsh at the University of Loughborough, found the situation was getting worse in places where child poverty was already at the highest level.
These areas are in large cities like London, Greater Manchester and Birmingham, with the rankings changing around a little, depending on whether housing costs are taken into account.

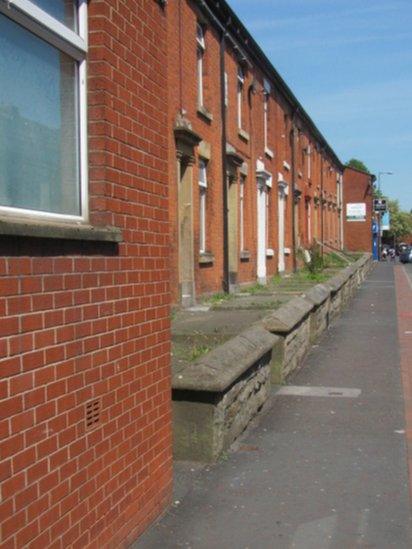
Streets like these in Bastwell, Blackburn, hide child poverty
But the ward with the highest level of child poverty in Britain is Bastwell in Blackburn. Here, 69% of children are living in poverty.
A community worker in the area, Abdul Muller, said he was surprised Bastwell came top of the table for child poverty in wards.
Mr Muller, who runs the Healthy Living charity at the Bangor Community Centre in the area, said high poverty rates were down to low pay, zero-hours contracts and cuts to support services.
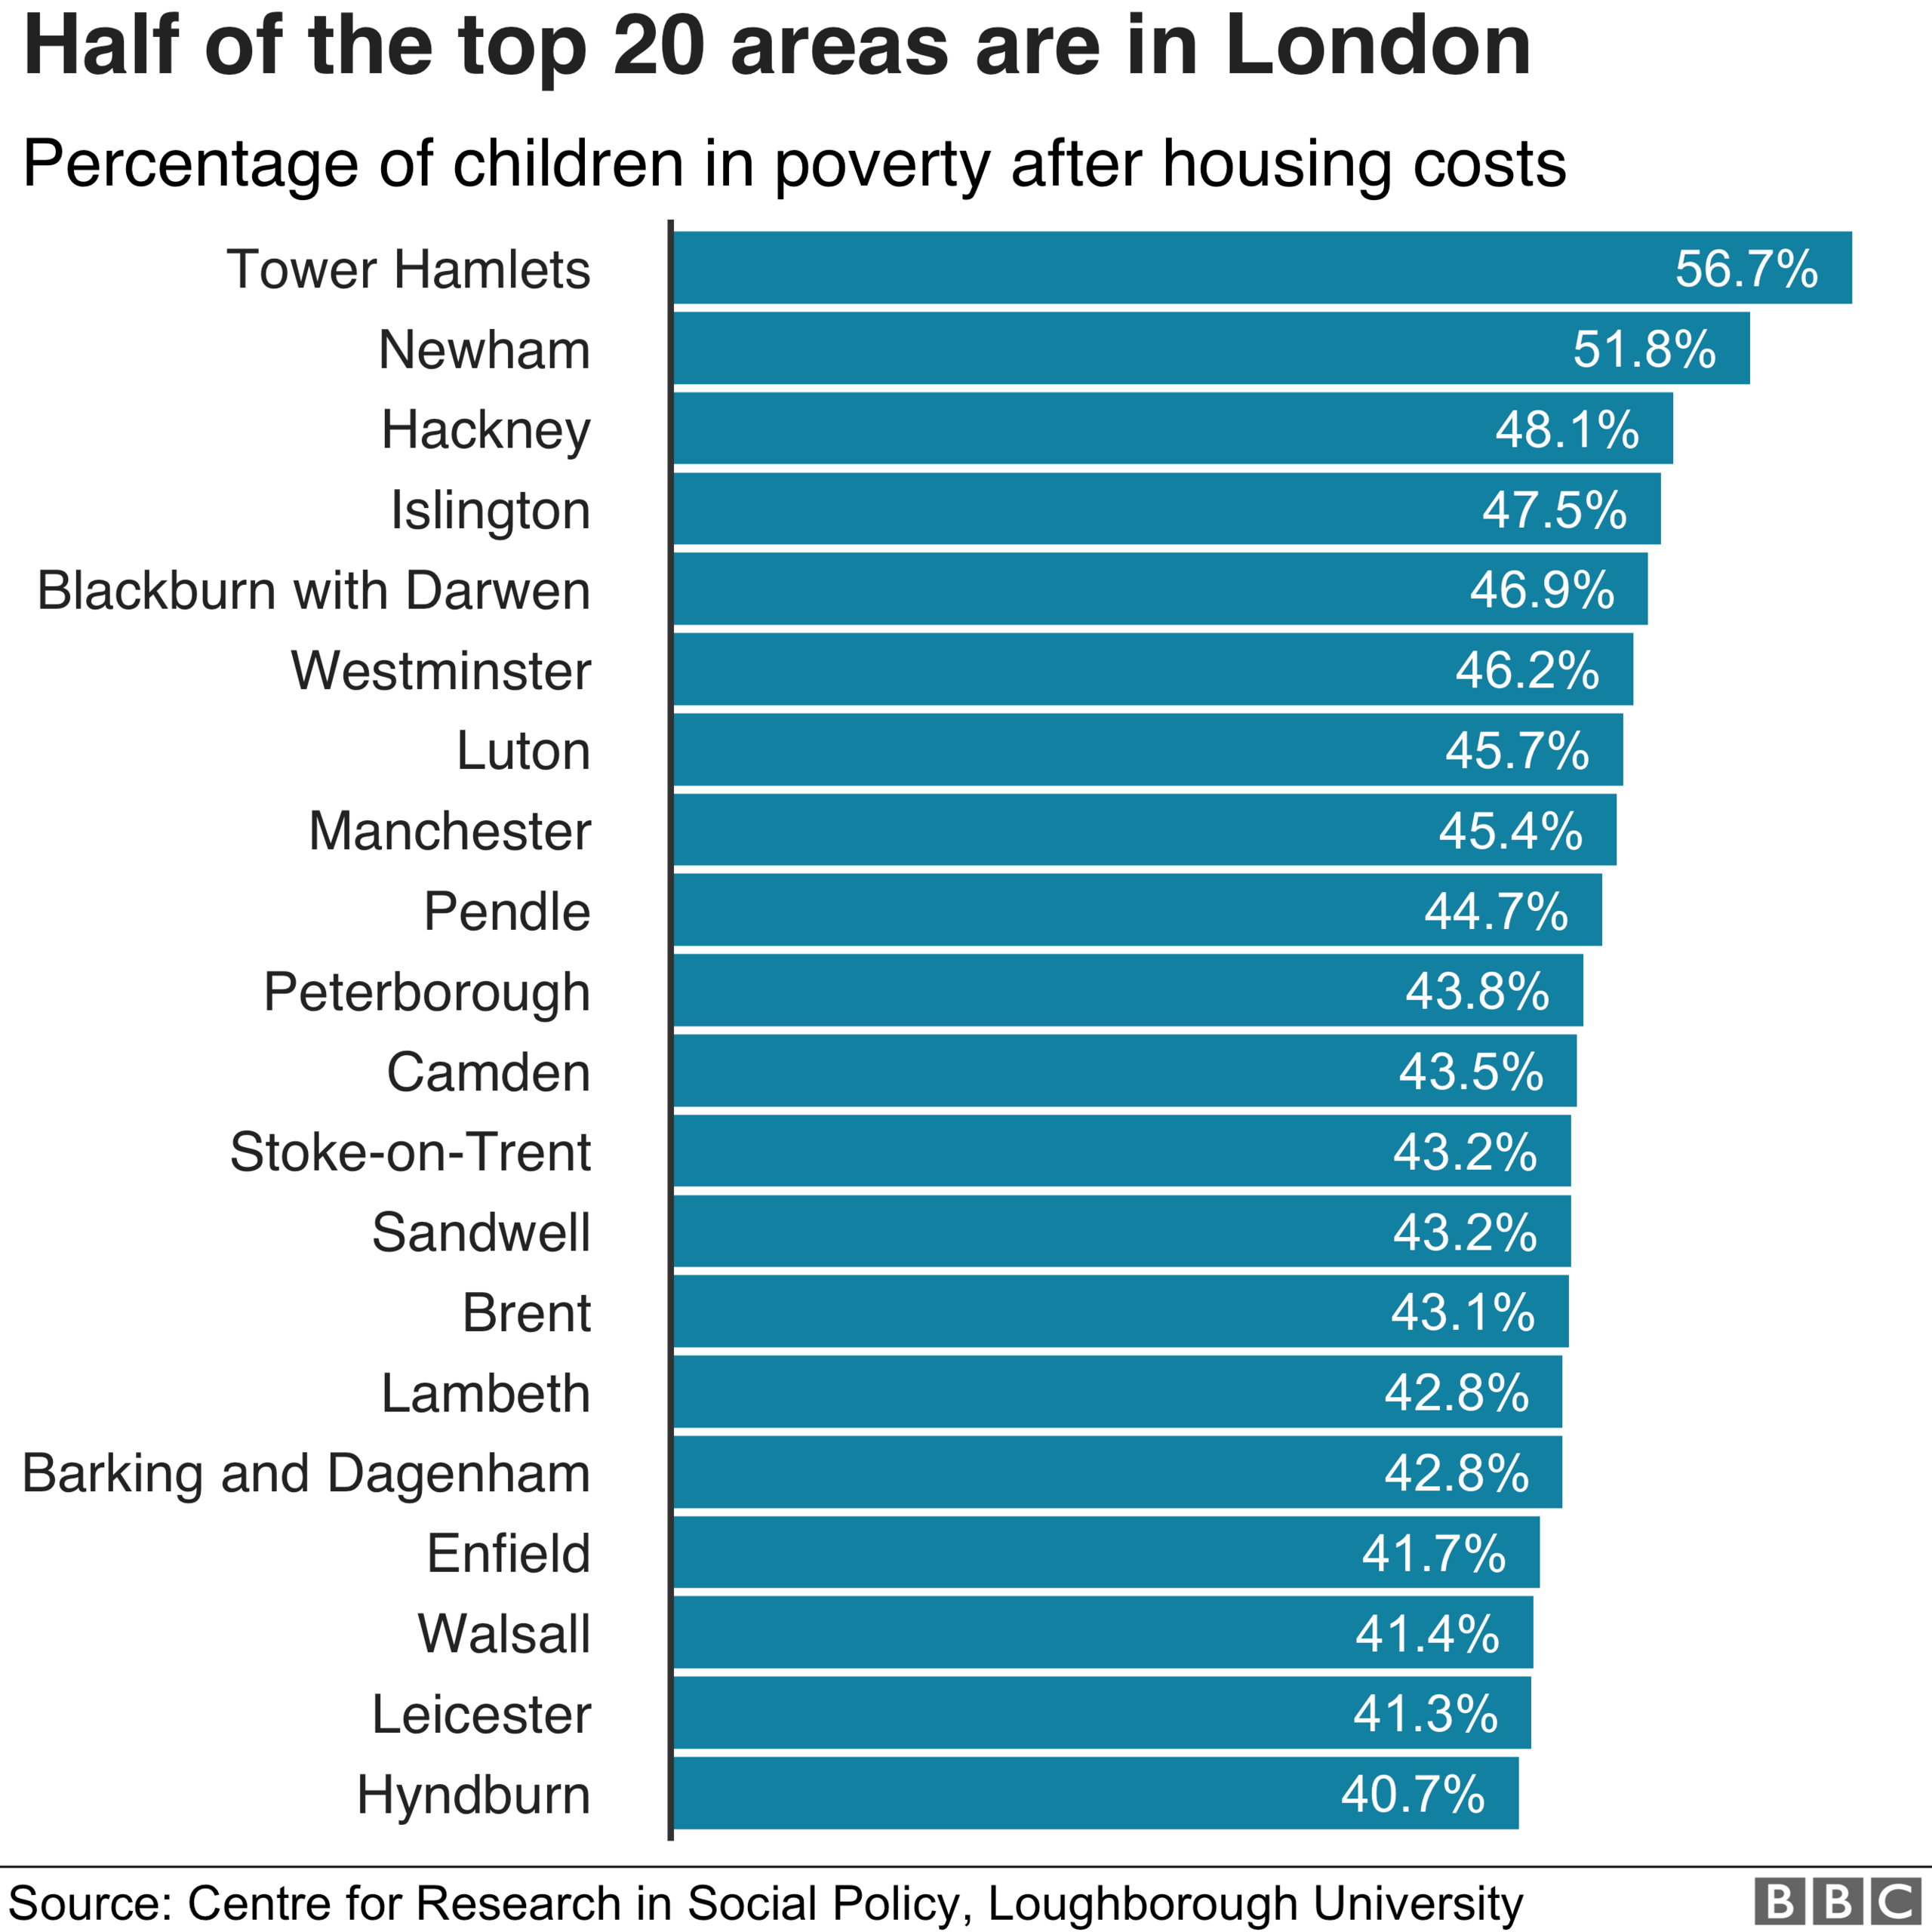
The top four hardest-hit areas, if housing costs are included, are the London boroughs of Tower Hamlets, Newham, Hackney and Islington.
In Greater Manchester, the child poverty rate (before housing costs) is 40% - nearly double the UK average of 22%.
'Not the exception'
Coalition chairwoman Anna Feuchtwang said: "In many areas growing up in poverty is not the exception, it's the rule - and with more children expected to get swept up in child poverty in the coming years, with serious consequences for their life chances.
"Policymakers can no longer deny the depth of the problem or abandon entire areas to rising poverty.
"The government must respond with a credible child poverty policy."
High employment rate
The results were calculated by combining official data on poverty indicators in local areas, such as unemployment, benefit take-up and the number of lone parents, to calculate the relative child poverty rates in local authorities, constituencies and by individual electoral wards.
Families are in relative poverty if they live on less than 60% of the middle household.

The cost of housing for each local area is factored in as well, to calculate real rates paid after housing costs are paid.
The method is used by the Office of National Statistics and the World Bank.
It shows that it was 2010 when child poverty began to rise again, after a long period in which it fell.
Prof Hirsch said: "What's shocking rather than surprising is that over the previous 12 to 15 years, we had a period when it was going down.
"We are now getting close to the time when we will have lost the gains we have made - half of those gains in reductions of child poverty have already been lost."
A spokesman for the Department for Work and Pensions said children growing up in working households were five times less likely to be in relative poverty, which was why it was supporting families to improve their lives through work.
"Statistics show employment is at a joint record high, wages are outstripping inflation and income inequality and absolute poverty are lower than in 2010.
"But we recognise some families need more support.
"That is why we continue to spend £95 billion a year on working-age benefits and provide free school meals to more than one million of the country's most disadvantaged children, to ensure every child has the best start in life."
- Published6 December 2018

- Published28 March 2019
