Reality Check: Is there a normal immigration level?
- Published

UKIP leader Nigel Farage says that levels of migration to the UK should be returned to what he calls the "normal" levels we saw between 1990 and 1997.
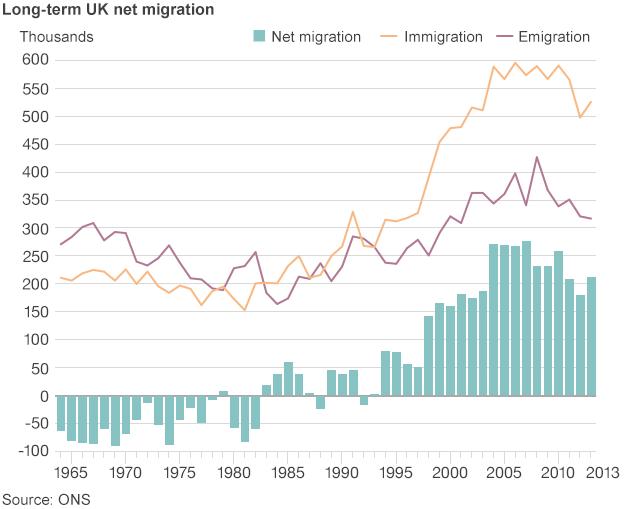
It is clear from the graph above that net migration (numbers coming to the UK minus numbers leaving) has increased since the late 1990s.
These are figures on long-term international migration from the Office for National Statistics, external (ONS) going back to when they started being collected in 1964.
Long-term migrants are ones who say they are planning to move countries for at least a year.
There have been increases in both long-term arrivals and long-term departures since the late 1990s, but the former has outstripped the latter.
Immigration
UKIP
Main pledges
- Points system used to select migrants with skills and attributes needed to work in the country
- Immigration capped at 50,000 people a year for skilled workers
- Five-year ban on immigration for unskilled workers
- Five-year wait before migrants can claim benefits

Mr Farage said on the Today programme on BBC Radio 4 that between 1990 and 1997: "Net migration to Britain ran at between 30,000 and 50,000 people a year - that was normality."
He's not exactly right about those figures. In 1992, net migration was minus 13,000 and in 1993 it was minus 1,000. So in both of those years more people left than arrived.
In 1994, it was 77,000, in 1995 it was 76,000 and in 1996 it was 55,000.
So in fact, in the eight-year period to which he referred, net migration was only in the range of 30,000 to 50,000 for three years.
The period did not follow an obvious trend, and it is hard to see why it would be described as "normal".
During the 1960s and 1970s, net migration was mainly negative, with more people emigrating from the UK than arriving to live here - perhaps that was normal.
In the 1980s, net migration moved into positive low levels and then started gradually increasing from the mid-1990s.
Since the turn of the century, annual net migration has been between 150,000 and 300,000 - maybe that's normal.
The point is that since records began in the 1960s, net migration has only been between 30,000 and 50,000 for six years, so describing that range as normal seems a bit odd.

Election 2015 - Reality Check

What's the truth behind the politicians' claims on the campaign trail? Our experts investigate the facts, and wider stories, behind the soundbites.
Read latest updates or follow us on Twitter @BBCRealityCheck, external
