Reality Check: Migration to the UK
- Published
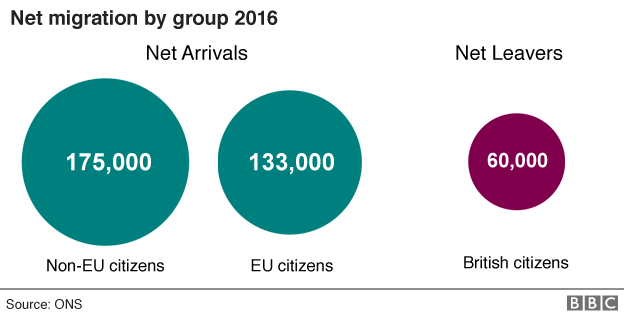
Net migration to the UK has fallen to about 248,000 in 2016, down 84,000 from the previous year, according to official estimates from the Office for National Statistics, external (ONS). Net migration is the number of people who have moved to the UK for at least a year minus the number who have left.
The ONS said the fall was due to more people leaving, especially EU citizens, as well as fewer people arriving.
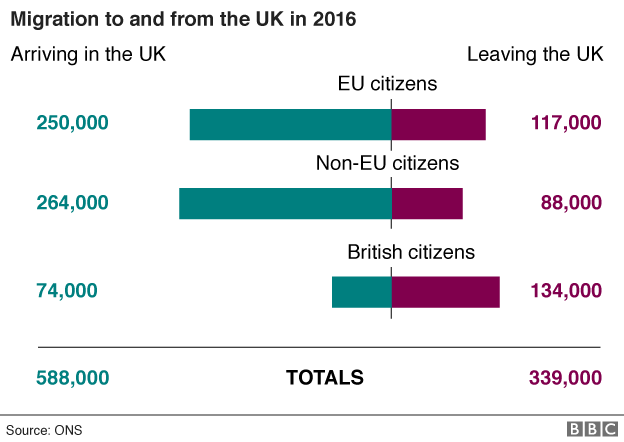
Immigration to the UK is estimated to be 588,000 - 250,000 EU citizens, 264,000 non-EU citizens and 74,000 British citizens.
At the same time, an estimated 339,000 people left the country: 134,000 British, 117,000 EU and 88,000 non-EU citizens.
About half of the EU migrants came from the original West European EU countries:
France
Germany
Italy
Belgium
The Netherlands
Luxembourg
Denmark
Ireland
Greece
Spain
Portugal
Austria
Finland
Sweden
A further 19%, 48,000 people, came from the eight countries that joined the EU in 2004, which the ONS said was the lowest estimate recorded:
Poland
Czech Republic
Slovakia
Hungary
Slovenia
Latvia
Lithuania
Estonia
The remaining 27% came from Romania and Bulgaria, the two countries that joined the EU in 2007, but have been allowed to seek employment in the UK freely only since 2014.

Why do people come to UK?
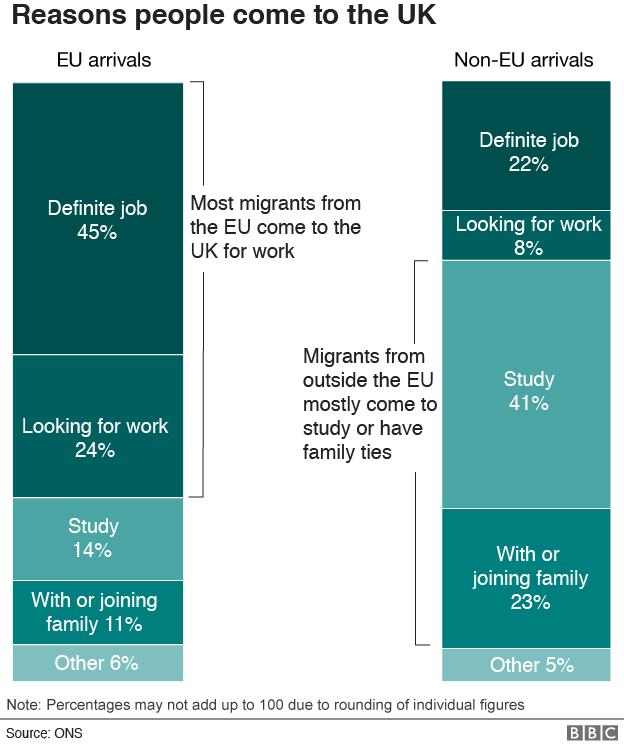
The reasons for coming to the UK vary, but most of the EU migrants who came in 2016 said their main reason for coming was either to take a job they had secured before they arrived or to look for a job.
On the other hand, most of the non-EU migrants said they had come to study, join family members already in the UK or accompany family members.

How many migrants are there already in the UK?
The migrants that arrived in 2016 joined an estimated 5.567 million citizens of other countries already living in the UK in 2015.
According to the ONS 2015 figures, external, nine in every 100 people living in the UK were non-British.
Of these, the number of EU citizens is estimated at 3.2 million, or five in every 100, and the number of non-EU citizens at 2.4 million, or four in every 100.

How has the proportion of EU and non-EU nationals in the UK changed over the past 15 years?
In 2001, the proportion of the EU citizens living in the UK was considerably lower - one per 100.
The proportion of non-EU citizens - at three per 100 - was also lower than now.
But by 2011 the proportion of EU citizens living in the UK had risen sharply.

What are the top nationalities of the migrants in the UK and how has that changed over the past 15 years?
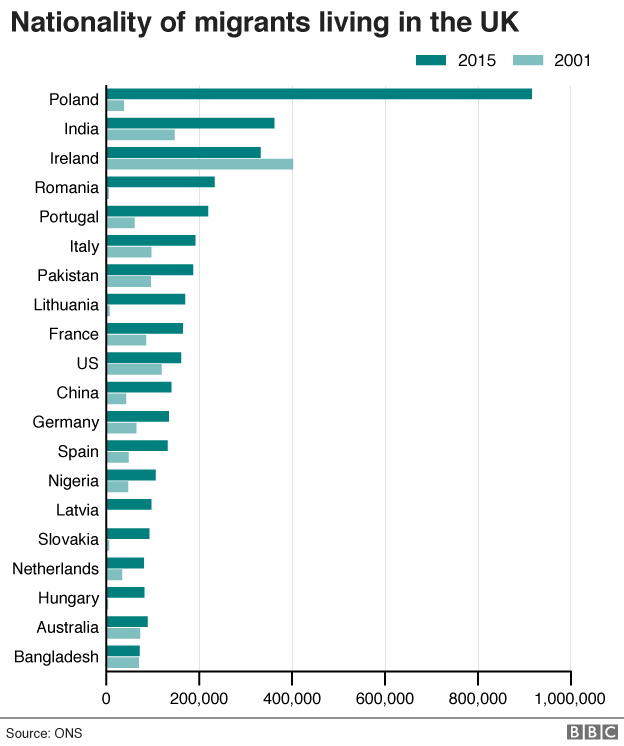
In 2001, the top non-British nationality living in the UK was Irish, with 402,000. The second was Indian, with 147,000, followed by the US, with 119,000.
The number of Polish nationals was 38,000, Romanian 5,000 and Lithuanian 7,000.
The situation had changed dramatically by 2015: Polish citizens topped the list with 916,000, followed by Indian citizens on 362,000.
Irish nationals are now the third biggest non-British group, with an estimated 332,000 living in the UK in 2015.
Romanian nationals are now the fourth biggest nation, with 233,000 citizens.
Lithuanian migrants are now the eighth biggest non-British group in the UK, with an estimated 170,000 citizens.
There has been a notable increase in the number of migrants from the older EU member states too: Portugal, Italy, France, Germany and Spain, as well as some non-EU countries, including Pakistan, China and Nigeria.


- Published19 May 2017
- Published23 February 2017
- Published1 December 2016
- Published7 November 2016
