England council results
Number of councillors
23 of 23 councils Counting complete
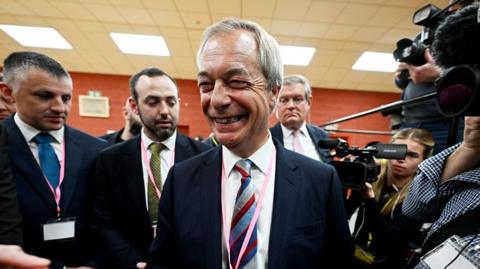
- Reform UK 677 councillors 677 councillors gained
- Liberal Democrat 370 councillors 163 councillors gained
- Conservative 319 councillors 674 councillors lost
- Labour 98 councillors 187 councillors lost
- Independent 89 councillors 20 councillors lost
- Green 79 councillors 44 councillors gained
Oxfordshire election results
2025 Liberal Democrat gain from no overall control
Oxfordshire council results
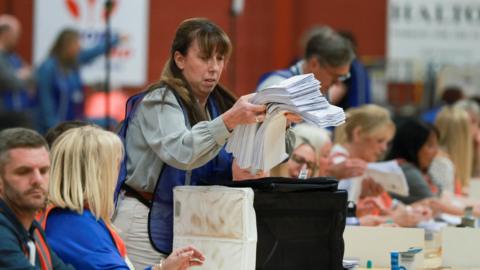
Counting complete. After 69 of 69 seats declared.
Liberal Democrat
- Councillors elected
- total 36 Councillors elected
- change +12
Labour
- Councillors elected
- total 12 Councillors elected
- change -3
Conservative
- Councillors elected
- total 10 Councillors elected
- change -15
Green
- Councillors elected
- total 7 Councillors elected
- change +4
Independent
- Councillors elected
- total 2 Councillors elected
- change +1
Reform UK
- Councillors elected
- total 1 Councillors elected
- change +1
Residents' Association
- Councillors elected
- total 1 Councillors elected
- change 0
About this council
- Type: County council - County councils are funded through council tax, government grants and business rates. They are responsible for services like social care, education, road maintenance, public libraries and long-term strategic planning. Other public services in a county council area will be controlled by the more local district council.
- Seats up for election: 69 out of 69
- Boundary change: Yes - 6 more seats
- Previous council results:
- 2021 - No Overall Control
- 2017 - No Overall Control
- 2013 - No Overall Control
- 2009 - Conservative


