Measles outbreak in maps and graphics
- Published
Which areas are at risk?
Measles is back and causing outbreaks in England and Wales.
It is a nasty and potentially fatal disease. It is also one of the most infectious viruses around.
Before vaccination there were hundreds of thousands of cases in epidemic years, but the disease was effectively eradicated in the UK after the MMR vaccine was introduced.
However, in 2012 there were more than 2,000 cases of measles in England and Wales - the highest figures for two decades.
This year has continued in a similar vein, with widespread cases and a large epidemic centred on Swansea.
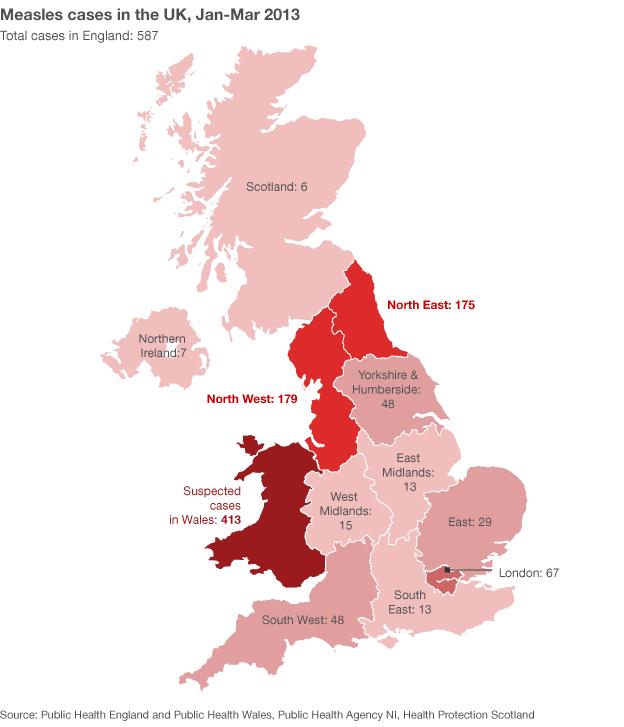
All figures are laboratory confirmed cases, apart from Wales which is notified cases
The cases in England are all "laboratory confirmed" by testing samples to ensure the patient did actually have measles.
The pace of the outbreak in Wales means the figures there relate to cases in which a GP suspects measles. This has not been confirmed and it is thought that 30% of suspected cases turn out not to have been measles.
Scotland and Northern Ireland have avoided large outbreaks.
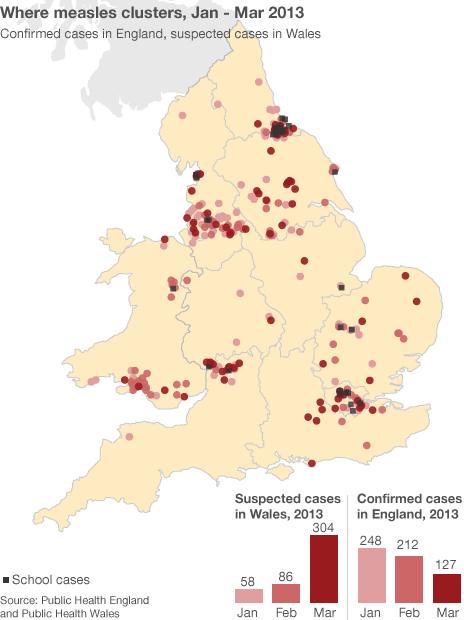
The number of suspected cases in Wales has been rising since November, with the biggest cluster now around Swansea and Neath and Port Talbot.

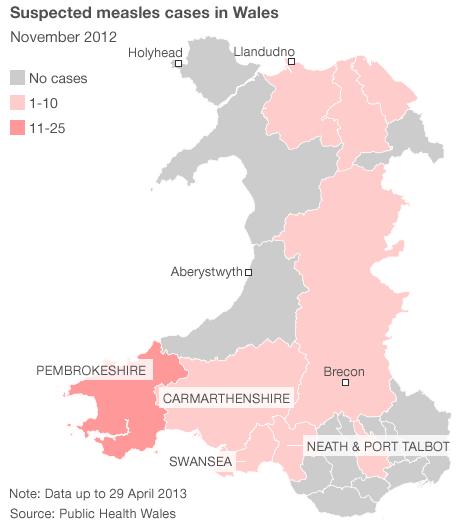
This series of maps shows how suspected measles cases have increased between November 2012 and April 2013. Each case represents a doctor's diagnosis and is not laboratory confirmed.
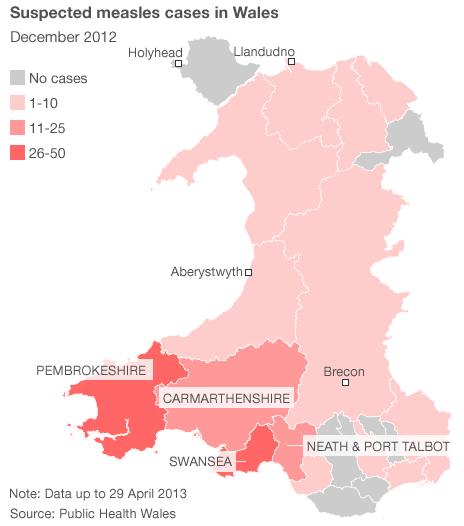
This series of maps shows how suspected measles cases have increased between November 2012 and April 2013. Each case represents a doctor's diagnosis and is not laboratory confirmed.
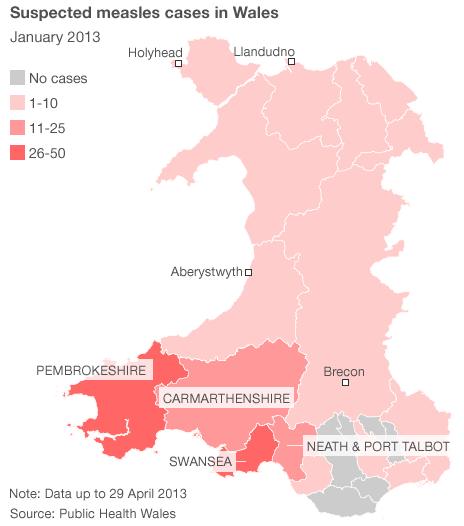
This series of maps shows how suspected measles cases have increased between November 2012 and April 2013. Each case represents a doctor's diagnosis and is not laboratory confirmed.
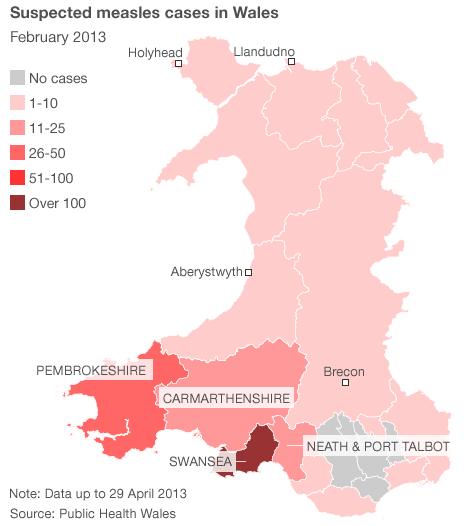
This series of maps shows how suspected measles cases have increased between November 2012 and April 2013. Each case represents a doctor's diagnosis and is not laboratory confirmed.
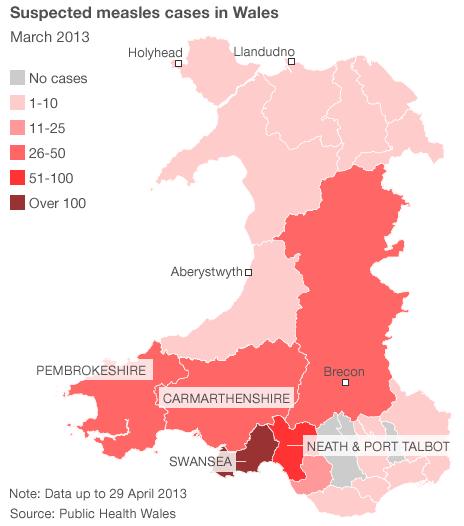
This series of maps shows how suspected measles cases have increased between November 2012 and April 2013. Each case represents a doctor's diagnosis and is not laboratory confirmed.
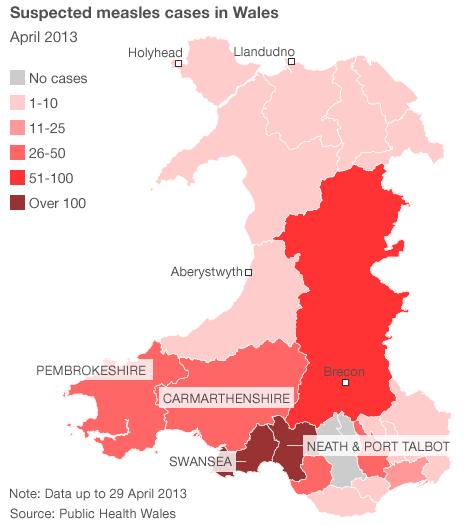
This series of maps shows how suspected measles cases have increased between November 2012 and April 2013. Each case represents a doctor's diagnosis and is not laboratory confirmed.
The current spread of measles is in stark contrast to a decade ago, when there were only a handful of cases. Measles was once effectively eradicated, with the only cases being those imported from abroad.
However, vaccination rates plummeted after, now discredited, claims of a link between the MMR vaccine and autism by Andrew Wakefield. It started in 1998, but the debate intensified and MMR uptake reached its lowest levels in 2003-04.
As the number of unprotected children increased, so did the number of cases.
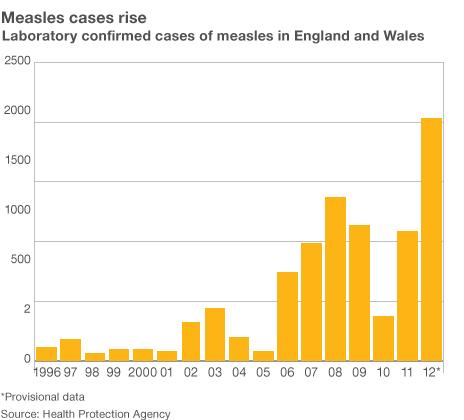
Infections are mostly in those children who were not vaccinated at the height of the MMR scare.
Health experts are particularly worried about London as well as the south and east of England. They had some of the lowest levels of MMR uptake, with some parts of London dropping to 50% of children vaccinated.
The cases at the opposite end of England have been put down to bad luck, despite the relatively high levels of vaccination there.
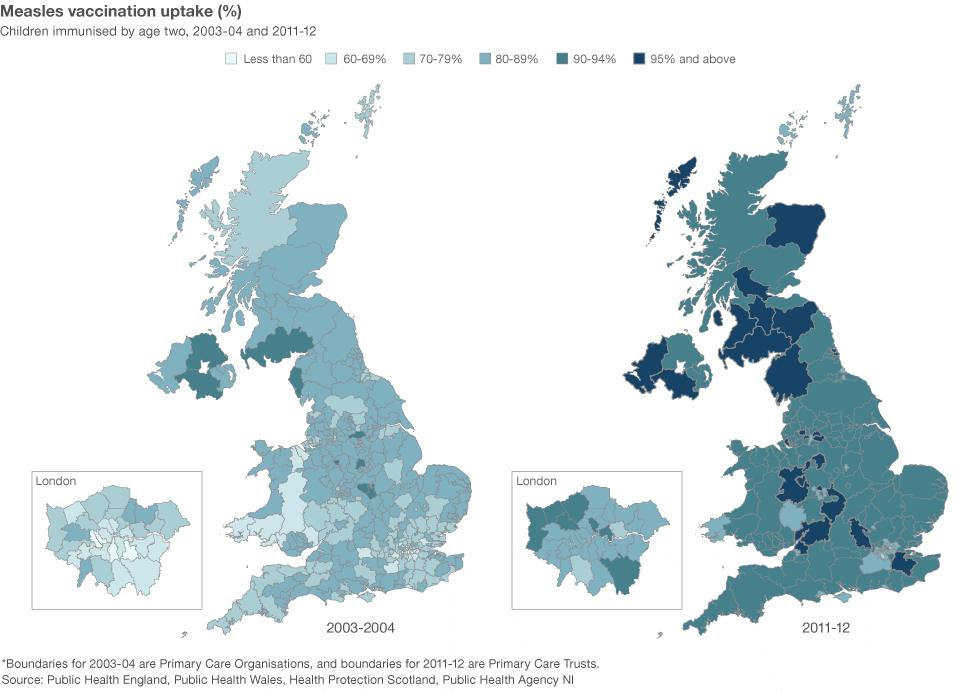
There has been a universal recovery in vaccination rates, which are now at record levels.
- Published18 April 2013
- Published19 April 2013
- Published18 April 2013