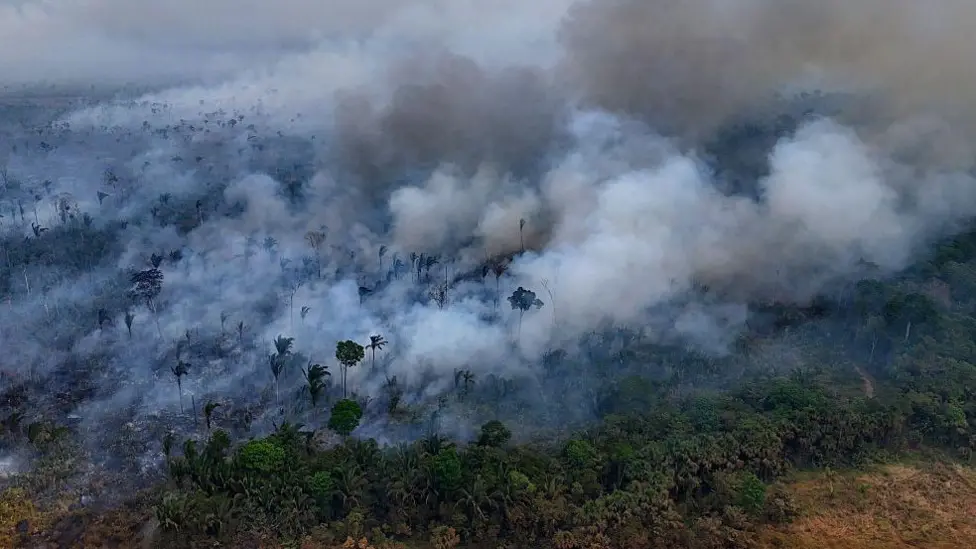
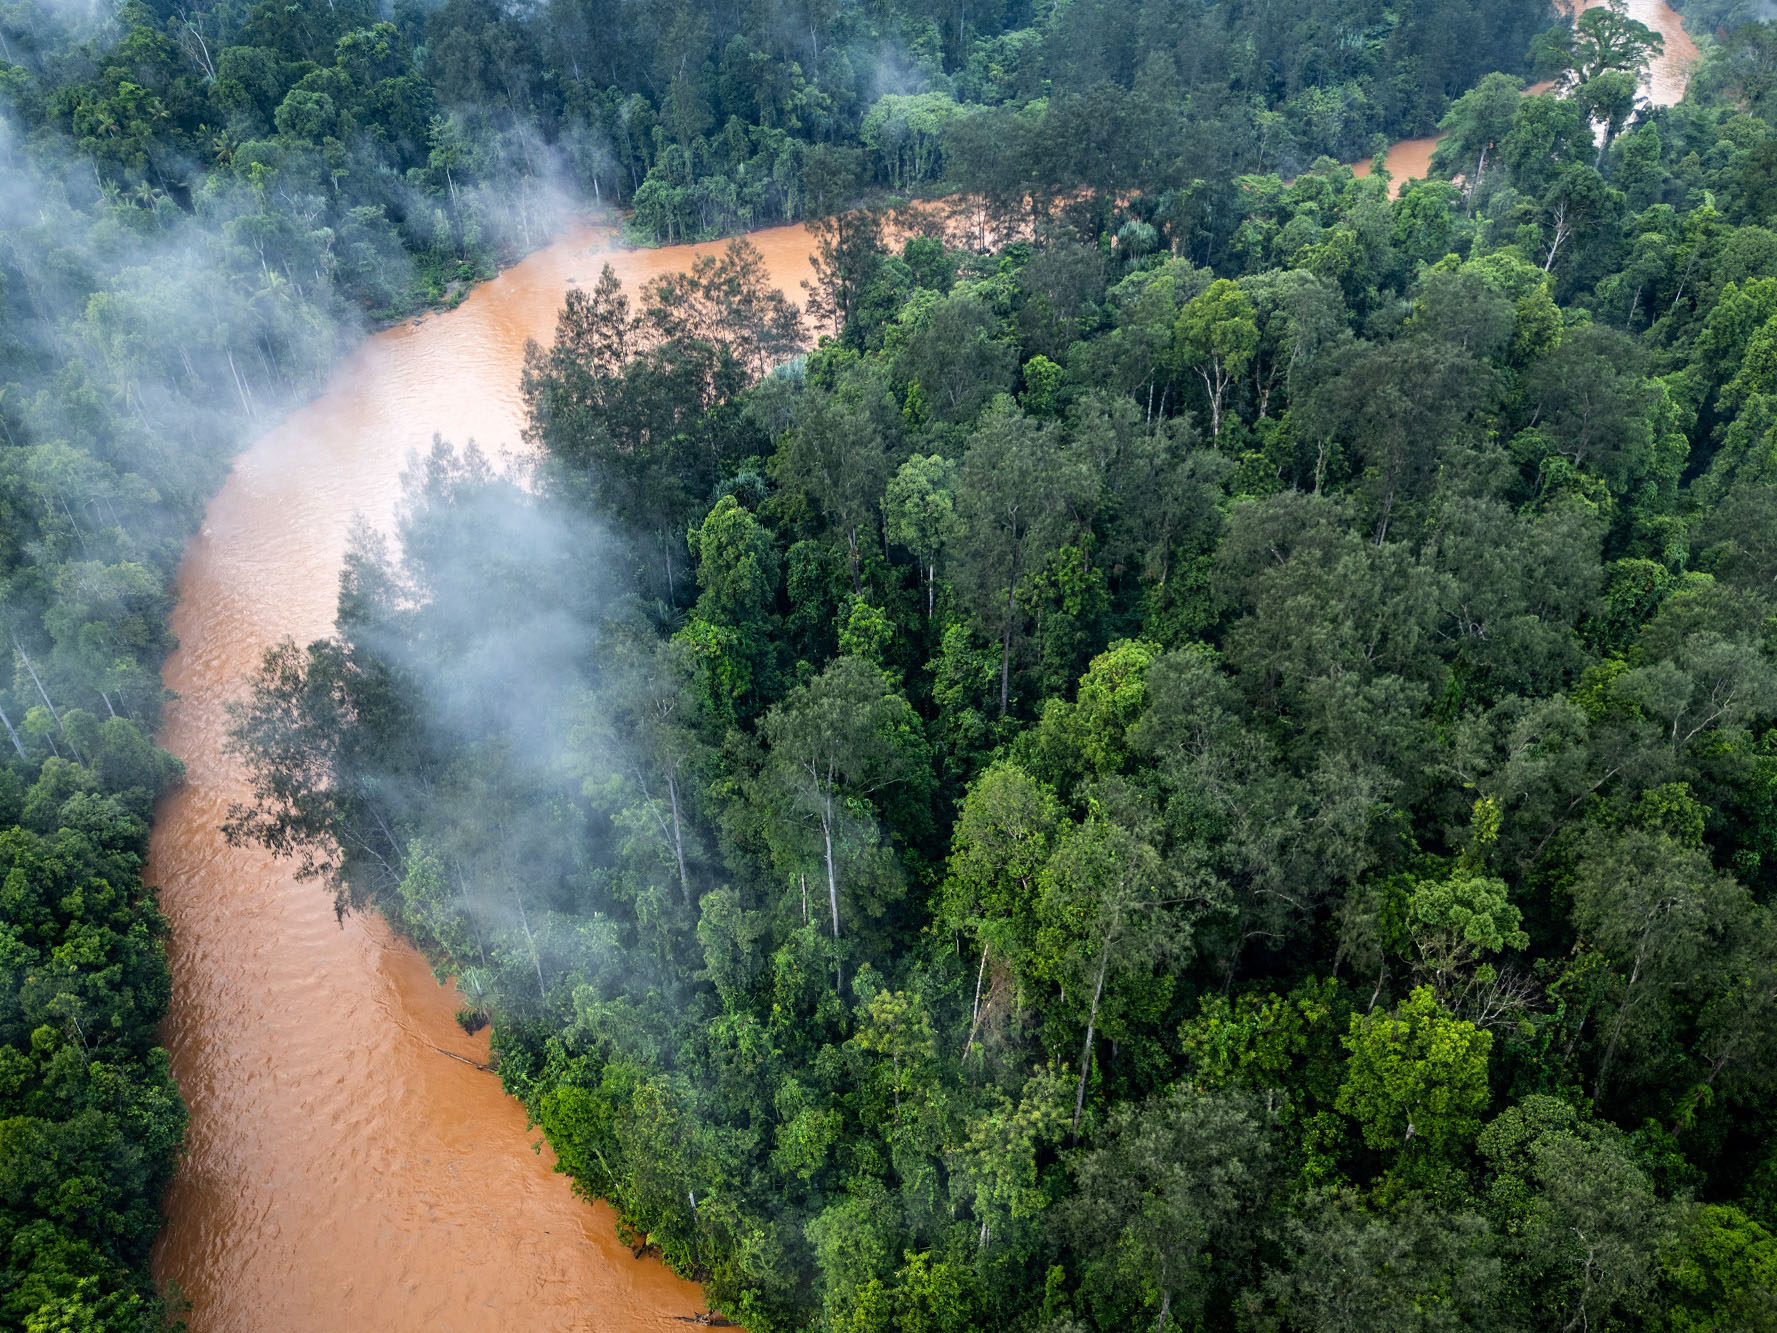
The world’s rainforests are vital for our survival. They cover just 6% of the world’s land, yet host half of the planet’s species and store billions of tonnes of planet-warming gases, helping to mitigate climate change.
But rainforests are dense and sprawling. Scientists have struggled to understand what lies beneath the treetops because even the most powerful satellites cannot penetrate their thick canopies - until now.

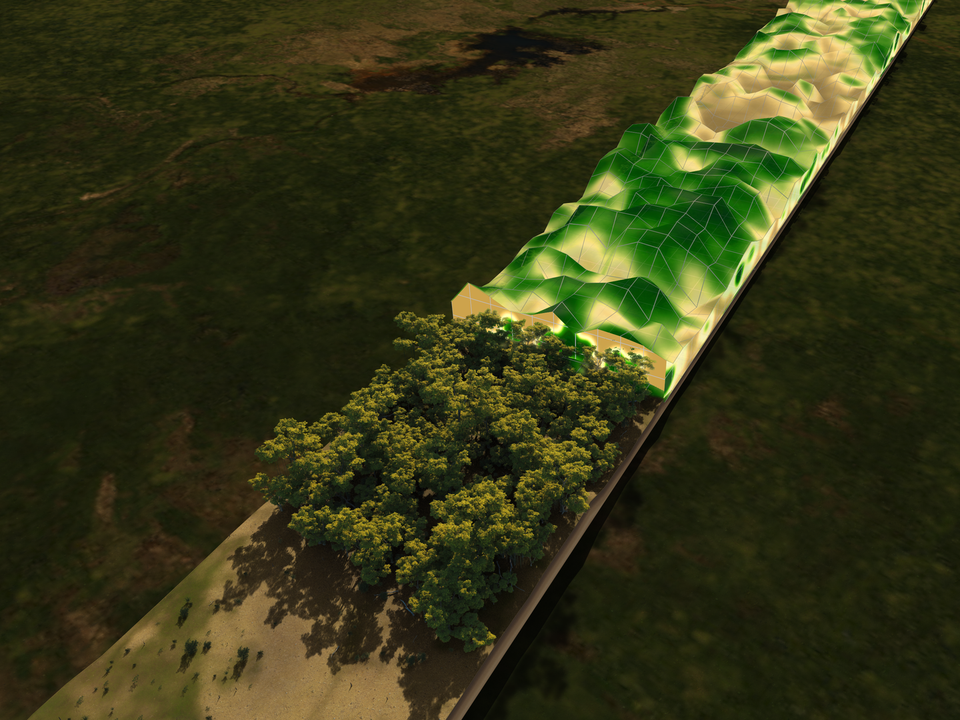
The vivid colours in these first breathtaking images from the Biomass satellite reveal what lies below the treetops, from wetlands previously hidden beneath the foliage to concealed deforestation.
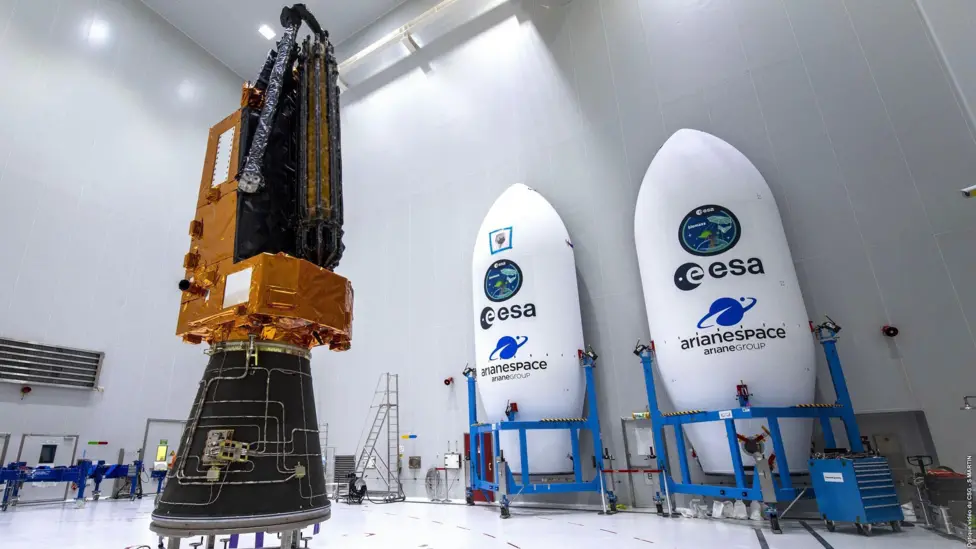
Twenty years in the making, the European Space Agency’s Biomass is the first satellite of its kind to use a specific radar frequency to “see” through clouds as well as dense foliage.
Scientists can now measure the amount of woody material in the trunks - where most carbon is stored - and better grasp the role these ecosystems play in fighting climate change.


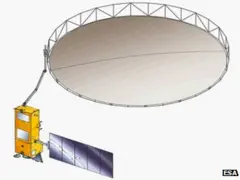
These images are only possible because of the unique radar technology aboard Biomass.
The satellite was launched on 29 April from French Guiana and has spent the last two months beginning to collect data over the tropics.

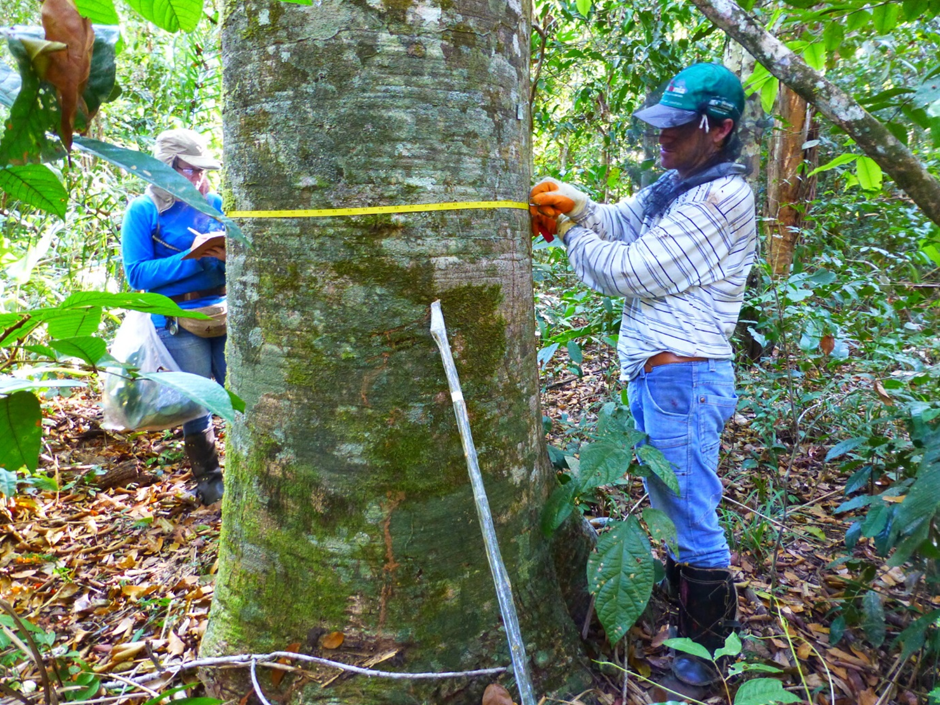
The data gathered by the satellite will be refined by teams of scientists who will head deep into remote areas of rainforest identified by Biomass to take measurements.
The ultimate goal, over the coming years, is to produce a global 3D map of the world’s forests, enabling scientists to accurately estimate how much carbon they store.
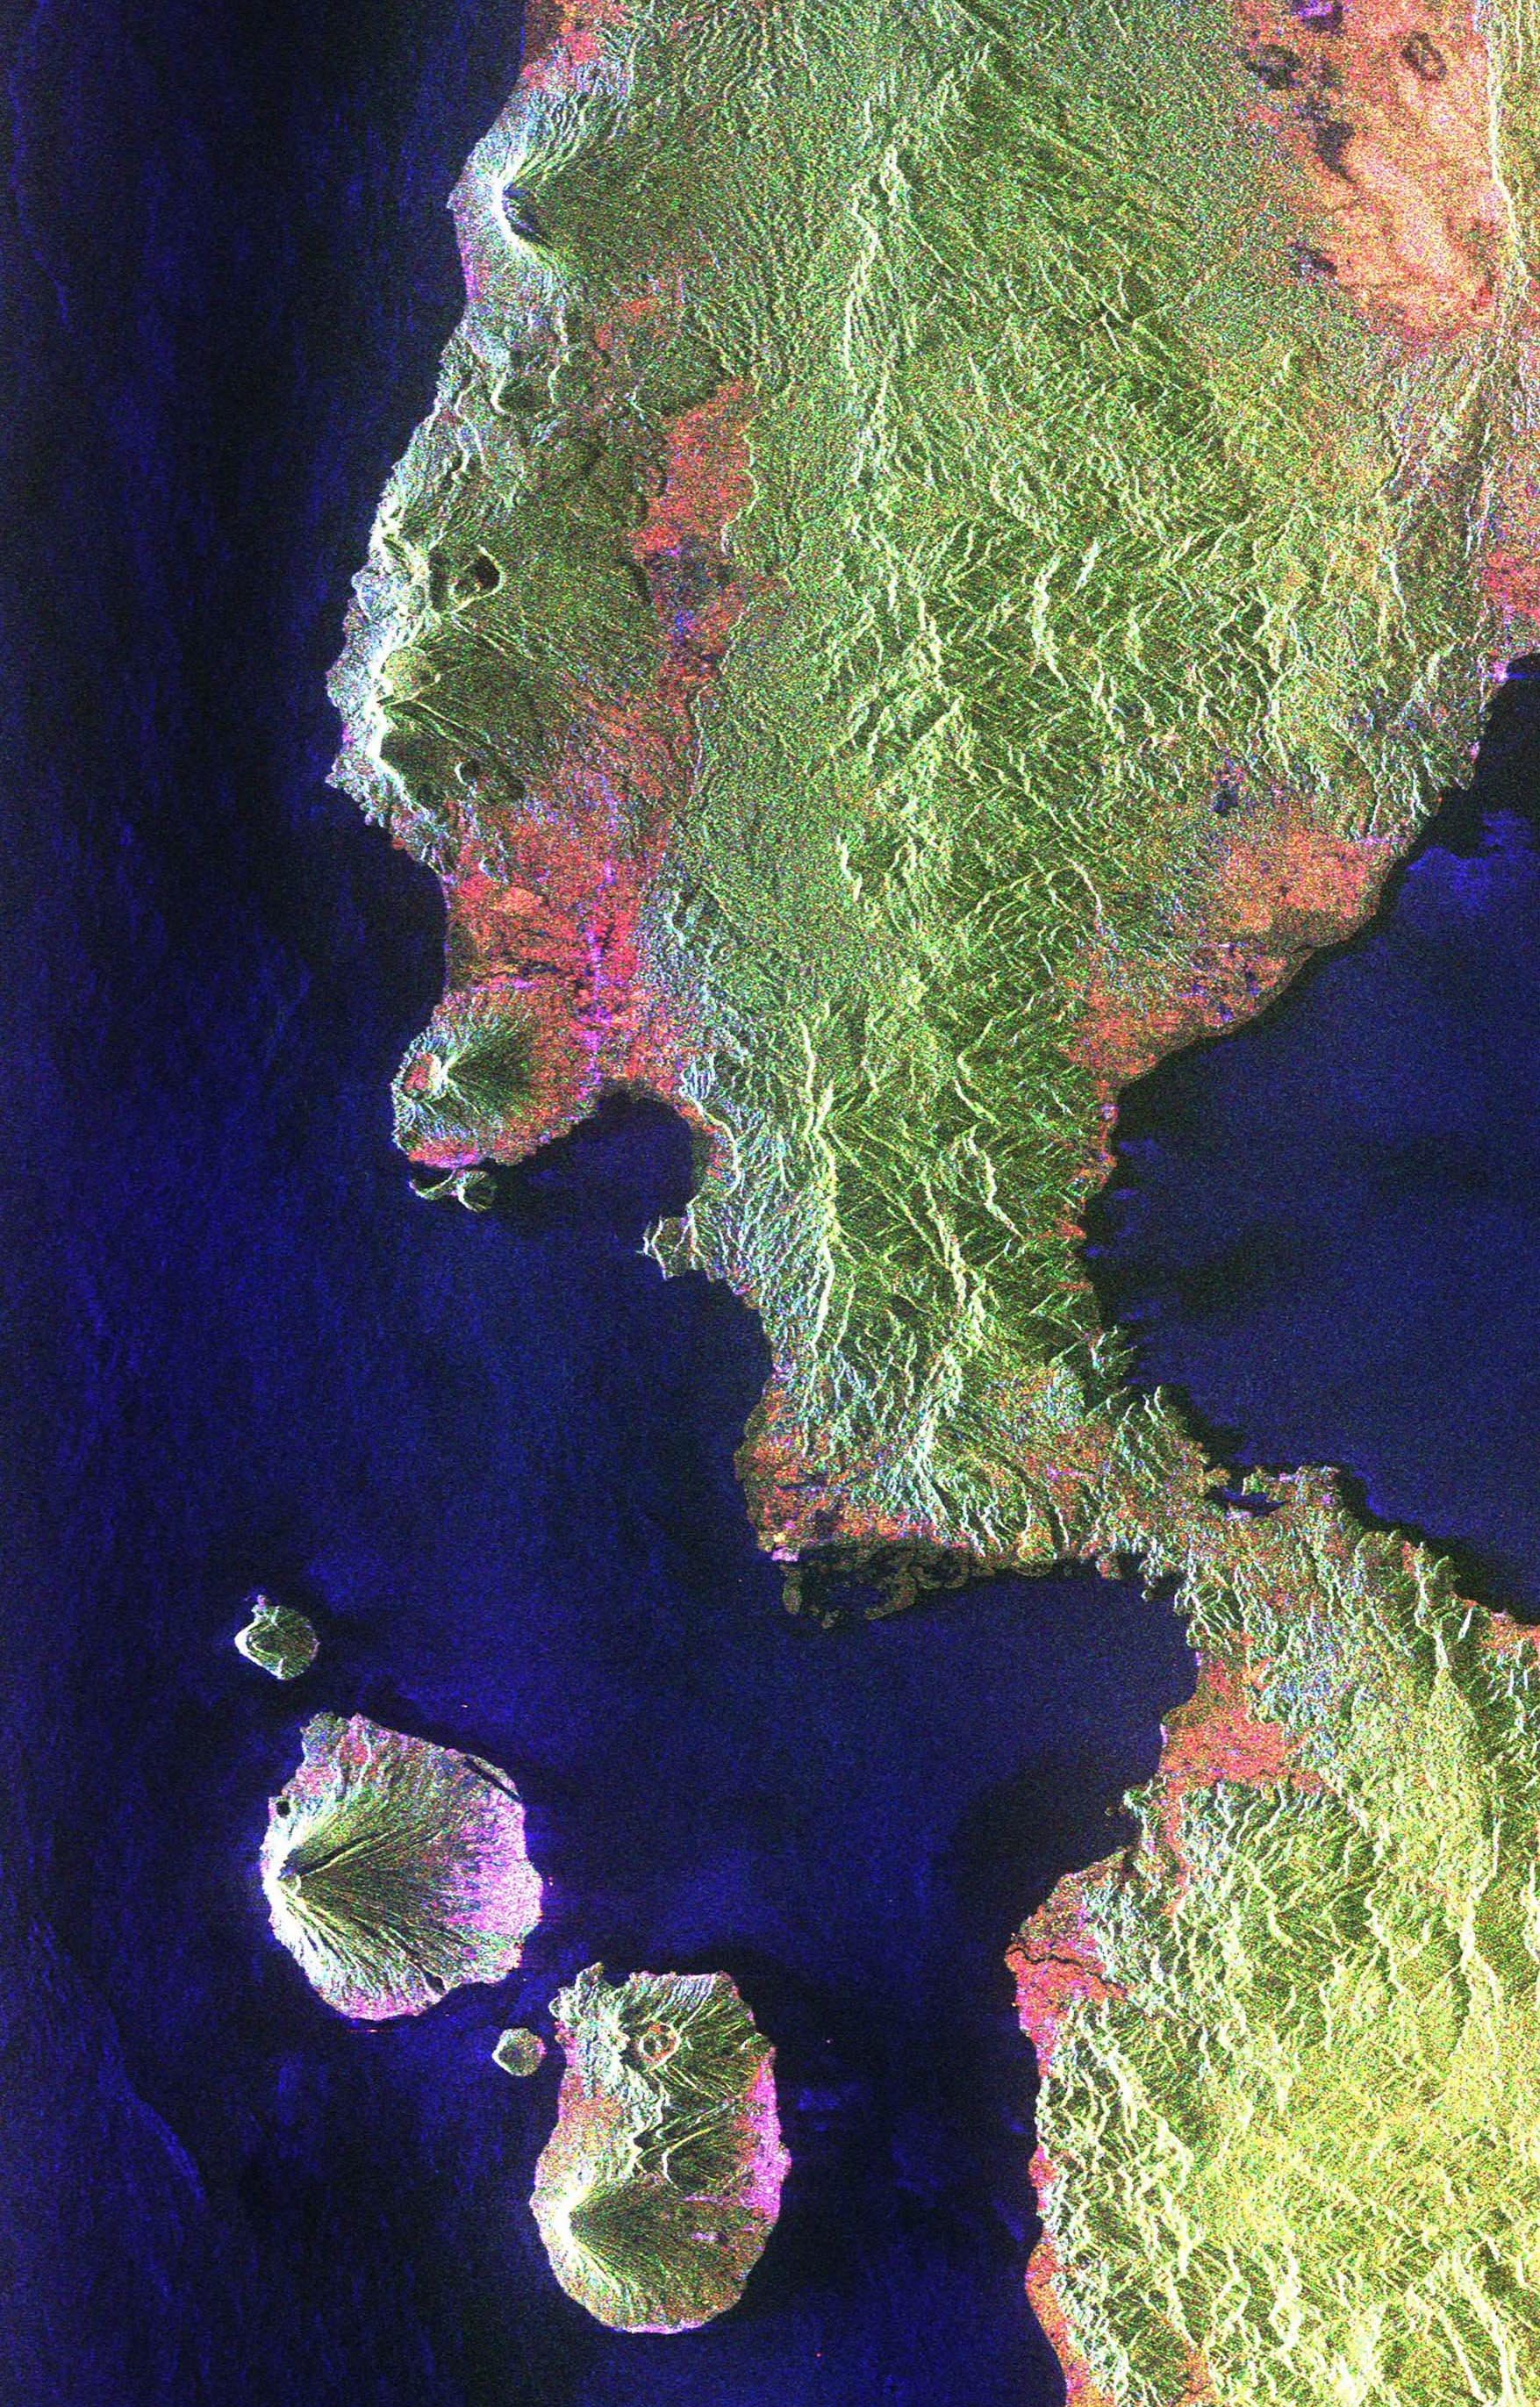
The Halmahera rainforest, located on the volcanic islands of Indonesia, is notoriously difficult for scientists to access due to its mountainous terrain.
Yet the Biomass satellite can see right down to the forest floor, showing where the trees grow across the rugged landscape and where trees have been cleared for farming.
As conventional satellites of this kind are unable to see beneath the treetops, patches of illegal deforestation can go unnoticed for months or even years. Biomass will help authorities to react more swiftly.
The long wavelength of the P-band radar also allows it to penetrate deep into ice. Unlike other radar wavelengths, it is less affected by snowfall, which can distort measurements.
One of the first images captured is a mesmerising view of the Nimrod Glacier in the Transantarctic Mountains of Antarctica.
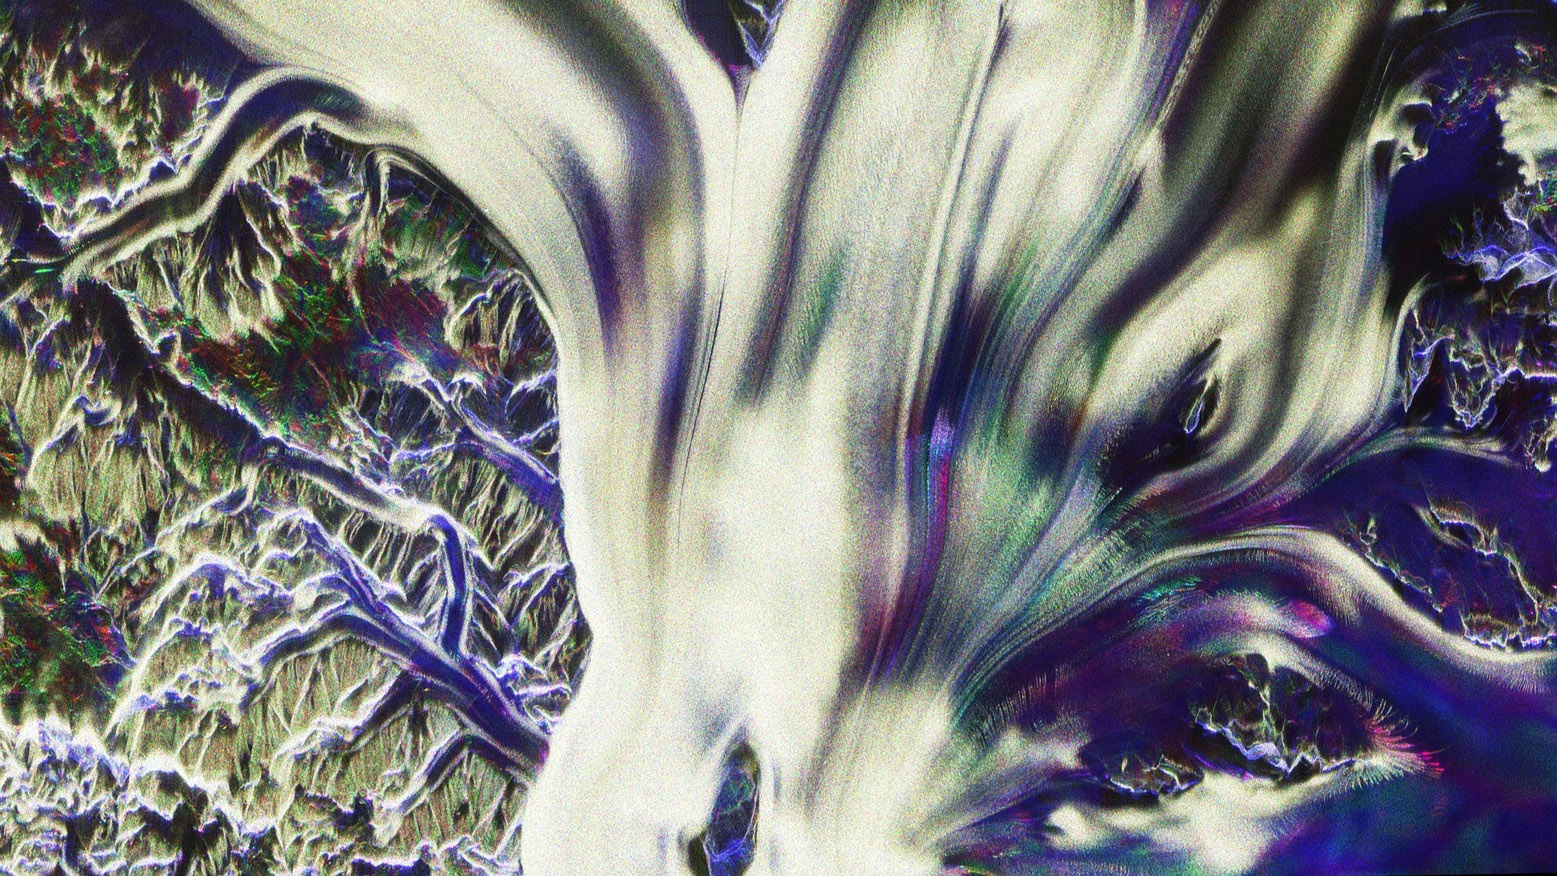
The large ice stream can be seen in extraordinary detail as it flows into the Ross Ice Shelf, surrounded by frozen tributaries. Purple areas show where the radar has penetrated further, because of differences in the structure of the ice.
These insights provide more accurate data on glacier movement worldwide, which is essential for the billions of people who depend on glaciers for fresh water, and who face increased risk as melting accelerates due to climate change.
Produced and edited by
Krystina Shveda, Daniel Wainwright and Tom Finn
Additional design by
Matt Mitchell-Camp