Thames archive reveals long nitrate rise
- Published

The study has profound implications for policies to monitor and manage the river's water quality
Scientists have assembled a remarkable record of water quality in the Thames that stretches back over 140 years.
The archive is thought to be the longest for any river in the world.
Putting it together involved hunting down old paper documents detailing monthly water tests. Some of them even had to be retrieved from the US.
The Bristol University-led team says the record provides a true baseline against which measures to keep the great river clean can now be judged.
But it also illustrates just how intractable the issue of nitrate pollution has become.
Over the 140 years of the new time series, this nitrogen component of river chemistry is seen to climb relentlessly. The pollution will almost certainly have altered the ecology of the river, shifting the balance of plantlife in the Thames.
Dr Fred Worrall describes the step changes in nitrate concentration
"Generally, Thames water quality has been improving - the fish are returning," explained Bristol's Dr Nicholas Howden, external.
"But the big challenge that remains is diffuse pollution, and the UK remains the global hotspot for nitrate flux.
"We have the highest export for nitrate for any country in the world per capita or per land area, depending on how you want to express it. And some of the highest concentrations are coming out through the Thames."
The presence of nitrate in the water is predominantly a consequence of land management decisions and farming practice.
Ploughing fields opens up organic matter to oxidation and the release of nitrogen held in the soils. This will eventually wash through to the river, as will nitrogen applied to those fields in the form of fertilisers.
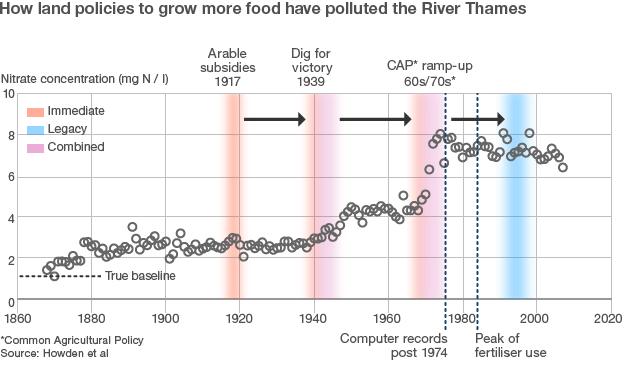
Clearly visible in the new time series are major land-use changes during the 20th Century that gave enormous nitrate kicks to the hydrology of the Thames basin.
Dr Nicholas Howden: A resource to compare with other river systems
Perhaps the most obvious is the "Dig for Victory" policy of 1939 that saw 30% of grasslands turned to arable production, as Britain sought to grow enough food to support the war effort.
Also evident is the impact of the European Common Agricultural Policy (CAP) in the 60s and 70s that witnessed the intensification of farming powered by the widespread use of agrochemicals.
But the team's analysis of the data throws up an astonishing feature in these kicks - they have two parts.
One is an immediate effect as surface run-off takes roughly 50% of the free nitrate straight into Thames tributaries and the main river. The other is a delayed effect that sees the other roughly 50% working its way through ground aquifers before washing out into the Thames.
"What we've found is that some of what we do to the land - we plough the fields and we add fertiliser - doesn't go through to the river for decades," said Dr Howden.
"There's a time delay. The water has to percolate through the soil, it's got to go through unsaturated rock, it's then got to go to the aquifer, and then it's got to be transported and discharged in the river."
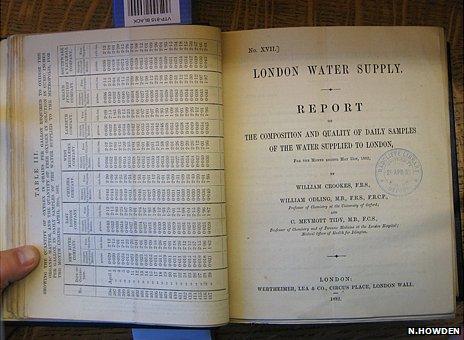
Today's water tests are held on computer, but to assemble the 140-year record the team had to chase down old volumes kept in the National Archives
This pathway can be deferred for three decades or more.
It means the 1939 kick seen in the nitrate "curve" above also incorporates some the delayed response from the land-use change brought about by the introduction of arable subsidies in 1917. The delayed release from the 1939 inputs is seen to amplify the immediate changes brought about by the ramp up of CAP in the 60s and 70s.
And the reason the curve stays stubbornly high even now is because the Thames is still responding to the deferred outputs from that intense CAP period.
"The 60s and 70s saw a gradual intensification," explained team member Dr Fred Worrall, external of Durham University.
"If your input is dispersed, your output is dispersed; if your input is sharp, your output is sharp. The aquifer is just transporting it; it's not processing it. The nitrate comes through as a pulse."
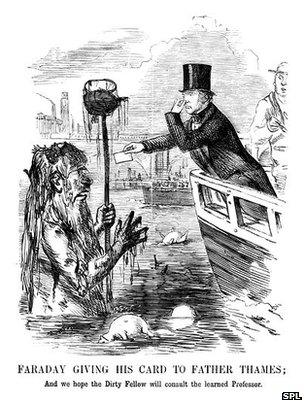
The appalling state of the River Thames in the late 1800s demanded action
The realisation that the effects of land-use changes in the Thames catchment take more than 30 years to show themselves fully has profound implications for policies to monitor and manage the river's water quality.
It means, for example, the benefits from the 1990s' introduction of Nitrate Vulnerable Zones (NVZs), which put controls on the application of manures to the land, cannot properly be assessed for at least another 15 years.
It is clear also from an analysis of the various inputs and outputs over the period that a lot of nitrate accumulated in the catchment has yet to come out.
"You can work out the budget, and there is a phenomenal amount of nitrogen accumulating somewhere in the basin," said Professor Tim Burt, external, also of Durham University.
"We don't know where and we don't know in what form, but it represents a potential legacy for a long time."
The 140-year record (1868 to 2008) of Thames water quality was assembled by drawing together and cross-calibrating at least six different data sets. Much of the material had been held in the National Archives, although some missing documentation had been transferred in a private collection to Stanford University in California.
The record is not simply a picture of nitrate concentrations. Other values recorded include ammonia, chlorine, water hardness (calcium and magnesium), dissolved oxygen and organic carbon.
Systematic water sampling in the late 19th Century was prompted by concern over cholera outbreaks and the generally appalling state of the Thames. In 1858, parliament was famously suspended because the stench coming from the river was so bad.
The research, which also involved Cranfield University, was part funded by the National Environment Research Council (Nerc). It has been published in a number of papers, most recently in an edition of Water Resources Research, external.
- Published30 August 2011
- Published19 August 2011
- Published31 December 2010
- Published12 October 2010