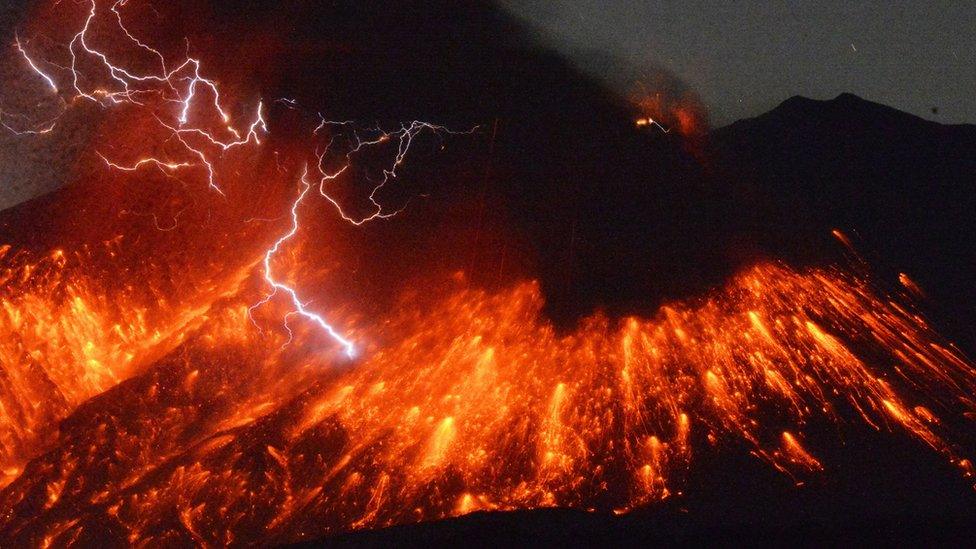
Volcano insight: Fifty years of eruptions revealed
- Published
Volcanologists say the app allows you to see the planet's breath and pulse
Half a century of the planet's volcanic eruptions and earthquakes have been visualised in an animated app.
It was created by the Smithsonian Global Volcanism Program, with additional data from NASA and the US Geological Survey.
The centrepiece is an a click-and-play animation showing every eruption and earthquake for the last 50 years., external
As well as monitoring active volcanoes, a global collaboration of researchers is gathering evidence of ancient eruptions in the geological record.
Elizabeth Cottrell, head of the Smithsonian Institution's program in Washington, DC, told the BBC that the animation was a view of "the living, breathing planet".
"You're watching the Earth respire - you're watching the pulse of the planet," she said.
"And you can see those patterns of where the tectonic plate boundaries are - the Earth's breath and pulse defines those plate boundaries."
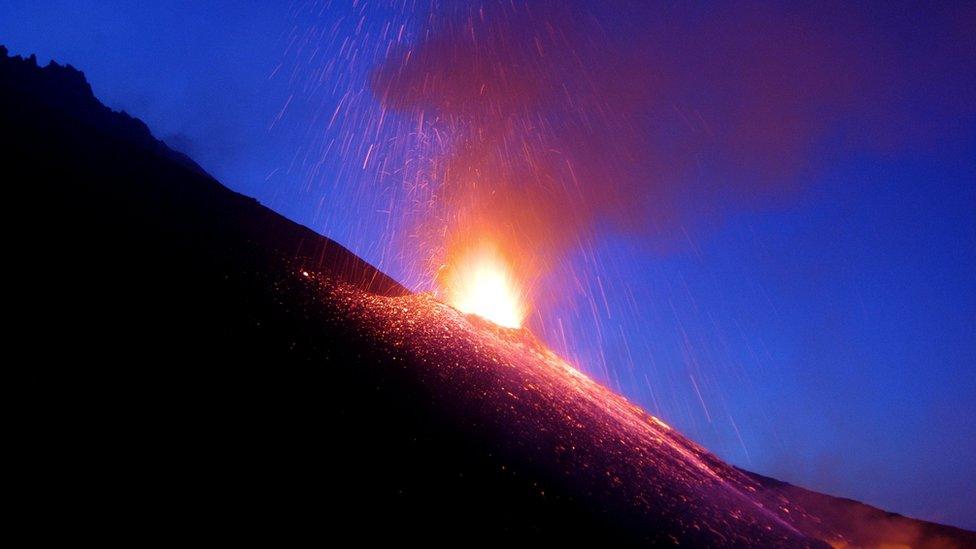
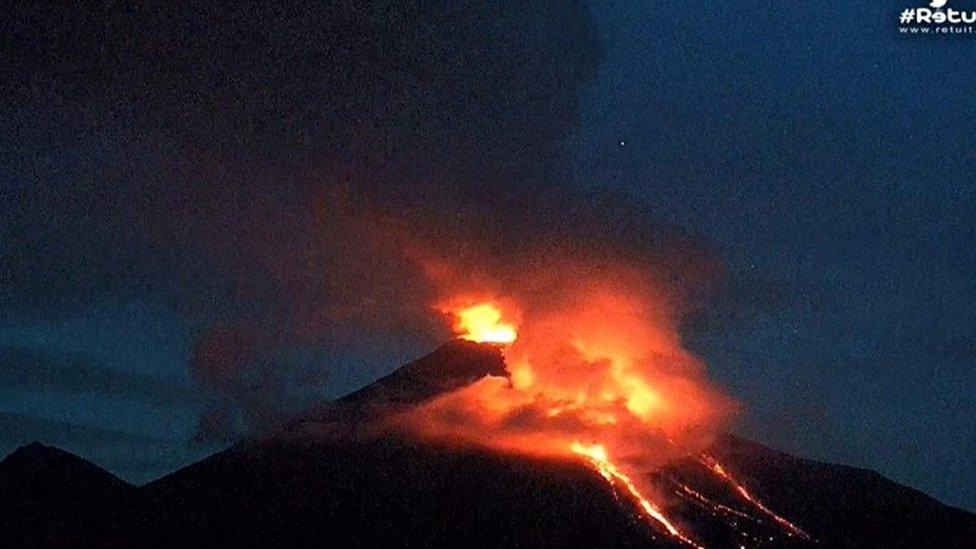
Beautiful but deadly: Mount Etna erupts at night
Forecasting eruptions
The Global Volcanism Program has been running since 1968, with a mission to "document, understand and disseminate information about global volcanic activity".
This global network of scientists is building a database of all known and confirmed eruptions for the last 10,000 years.
Some of these remain as signals of ancient ash or lava left in rocks. But the program also uses scientific literature, eyewitness accounts and even old ship's logs, some of which contain detailed accounts of eruptions.
"Captain Cook provided a lot of information about volcanoes erupting that he saw," remarked Dr Cottrell.
But the last 50 years is a crucial period, because the scientists say they are confident that they have a complete record of every eruption and earthquake over that time.
Making it available to download and in an app, Dr Cottrell said, could be of value to scientists who are looking for patterns that help to improve volcanic eruption forecasting.
Individual volcanic eruptions on a human timescale can seem rare, but volcanic arcs - chains of volcanoes along the same plate boundary - have what Dr Cottrell described as "a sort of pulse".
"When we're looking for patterns in the timing, we can look at a recurrence interval on the geological timescale," the scientist told BBC News.
"But what's really critical about this data-gathering effort, which exceeds what you see in the app, is that you're seeing the numbers of fatalities and the characteristics of each of these eruptions."
This detailed study is allowing the program to forecast not only when an eruption might be expected, but what a particular volcano will produce when it erupts.
"For the public," Dr Cottrell added. "I think there's a real power to getting out of the news cycle about a particular eruption, like the volcanic eruption in Iceland that stopped air traffic in 2010, and realising that there are eruptions happening all the time."
- Published6 October 2016
- Published1 October 2016
- Published1 October 2016
- Published28 September 2016
- Published14 September 2016
