Satellites picture methane across the globe
- Published
Variations in the concentration of methane in the atmosphere from June to October
Want to understand what methane is doing in our atmosphere?
Take a look at the new interactive global map, external produced by Montreal firm GHGSat.
Its Pulse tool allows you to move around the world to see how concentrations of the powerful greenhouse gas vary in space and time.
From the highs above oil and gas fields in the southwestern United States, to the naturally elevated levels in permafrost regions during summer.
The map shows monthly averages which, GHGSat says it will update weekly.
Pulse combines the focussed data from the company's two small methane-detecting spacecraft with the wide-field observations from the EU and European Space Agency's Sentinel-5P Tropomi mission, external.
The Canadian pair are used to "tune up" the European detections so the map can display concentrations on a 2km by 2km grid scale.
The influence of coal mining: Visualisation of methane concentrations over northern China
Centre the map over northern China and you can see the effect the country's coal mines have in raising concentrations.
Move across to northern Italy and look at how the Dolomite Mountains trap methane in the Po Valley, as they do all pollutants emanating from this industrialised sector of the nation.
Just like carbon dioxide (CO2), Methane (CH4) is increasing in the atmosphere. The globally averaged monthly trend, external is now above 1,876 parts per billion
Quite why methane is climbing as rapidly as it is, though, is not fully understood.
Emissions associated with fossil-fuel use are obviously a major factor, but there are many natural sources of the gas that require a more complete explanation, too.
What is certain, however, is that the rise can't be left unchecked.
Methane's global warming potential, external is 30 times that of carbon dioxide over a 100-year time period, so it's imperative any unnecessary releases are constrained or curtailed.

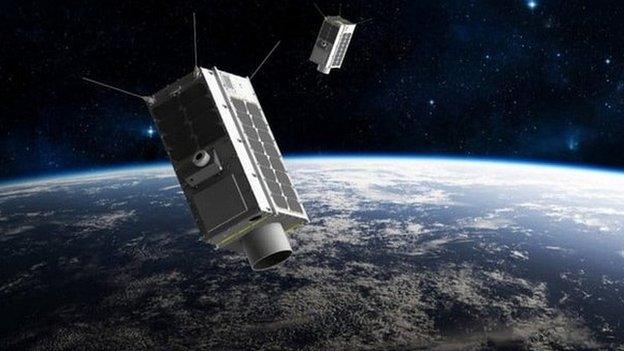
Artwork: GHGSat is aiming for a constellation of greenhouse-gas monitors in the sky
GHGSat's business is about identifying human-produced sources and working with those responsible to close off the emissions.
But company CEO, Stephane Germain, hopes the new Pulse map will initiate a much wider conversation about the methane issue.
"This is about a bunch of things for us," he told BBC News. "First and foremost, we constantly get asked if we can make some of our data and expertise available for free, and Pulse is part of our contribution to that.
"The data and the algorithms we've used are open.
"But we're also making this map available to let everyone see what methane looks like worldwide on a more granular, higher-resolution scale than has ever been available before. And we hope that'll stimulate some conversations and some questions."
GHGSat launched its most recent satellite, Iris, in July. This has the sharpest view of any methane-detecting spacecraft in orbit today by being able to track variations in CH4 concentration in columns of air just 25m across.
Once fully commissioned, Iris will be used to identify individual emitters, such as a leaky wellhead or landfill.
Summer warming at high latitudes boosts natural methane emissions
The aim of the company is to fly a constellation of Iris-like satellites, and to that end - a third platform, called Hugo, is scheduled to launch in December.
"We want Pulse to keep evolving as other satellites come online; there are other satellites being built right now to monitor methane," Dr Germain said. "We want to ingest multiple other sources of information to provide a combined look at what's going on in the world."
GHGSat plans to set up its global analytics hub in the UK with a base in Edinburgh.
The Scottish capital's university is renowned for its expertise in atmospheric studies.
Prof Paul Palmer leads the university's Atmospheric and Composition Modelling Group, external.
He welcomed the Pulse release.
"Anyone can now easily visualise changes in atmospheric methane across the world that reflect the rich diversity of natural and human emissions and atmospheric chemistry," he told BBC News.
Jonathan.Amos-INTERNET@bbc.co.uk, external and follow me on Twitter: @BBCAmos, external