Five mind-blowing facts about what the UK looks like
- Published
- comments

For the past few decades, satellites have been taking high definition pictures of the United Kingdom from space. The images are analysed and compared to detailed maps.
Every small area is then given one of dozens of different classifications - from airports to vineyards, glaciers to rubbish dumps.
The work is part of an EU project, external keeping an eye on changing land use. Is urban sprawl eating into our precious green landscape? Are forests being felled? Are grasslands and wetlands under threat?
Now, using this data treasure trove, we can get a clearer picture of what every corner of the United Kingdom really looks like.
And the results may come as a surprise.
To test the accuracy of your impression of the UK, here are five questions on UK land use.
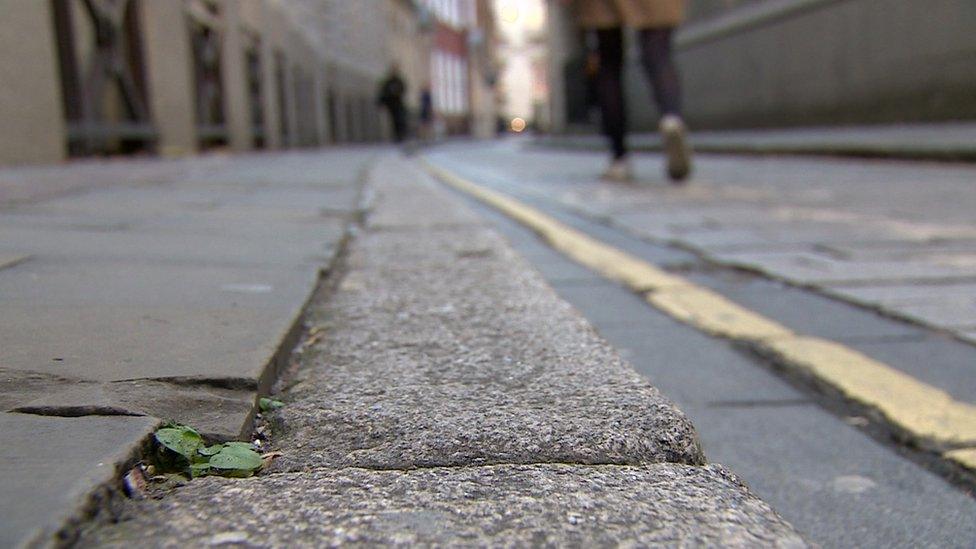
One of the classifications is "continuous urban fabric" (CUF), applied to areas where 80-100% of the land surface is built on. Up to a fifth might be gardens or small parks, but the vast majority is built on. The City of London is the local authority with the highest proportion of CUF in the country - 98%.
1: What proportion of the whole UK is classified as continuous urban fabric?
A: 0.1%
I am going to guess that was lower than you expected. Continuous urban fabric is actually a very rare land use in the UK. There is another category called discontinuous urban fabric, places where between 50% and 80% of the land surface is built on. Many of our urban areas are greener than you think.
2: What proportion of the UK is classified as discontinuous urban fabric?
A: 5.3%
You are probably suspecting that these figures are missing something, but a variety of different land use data sources come up with broadly the same picture.
The UK National Ecosystem Assessment, external (NEA), for example, estimates that less than 1% of the country is "built on", about 2% of England. I wrote about their work five years ago.
Ordnance Survey data suggests that all the buildings in the UK - houses, shops, offices, factories, greenhouses - cover 1.4% of the total land surface. Looking at England alone, the figure still rises to only 2%.
Buildings cover less of Britain than the land revealed when the tide goes out.

The complaint that vast swathes of our landscape have been "concreted over" doesn't stand up to scrutiny. Although, the impact of urban development clearly extends beyond its physical footprint, in noise, pollution and infrastructure.
It is also true that the psychological effect of the built environment is greater than other land use types because most of us spend the vast majority of our time surrounded by it. We live our lives in buildings, on roads and pavements and tend, as a result, significantly to overestimate how much of it there is.
It is often only when we fly home from holiday and look down that we are reminded just how green our country actually is.
To get a clearer idea of how UK land is used, we have divided the 44 different land use types into four broad categories:
farmland - pastures, arable land, orchards, vineyards et cetera
natural - moors, forests, lakes, grasslands et cetera
built on - buildings, roads, airports, quarries et cetera
green urban - parks, gardens, golf courses, football pitches et cetera
This reveals most of the UK land mass (57%) is devoted to agriculture, and just over a third (35%) might be termed natural or semi-natural. The categories will always be open to debate because, for instance, moorland used by sheep farmers could be placed in either grouping. We chose to put moorland into the "natural" category.

The question of how to deal with urban landscape is equally problematic. It is clearly important to quantify how much "green" urban there is in our towns and cities. Parks and gardens matter to people. Equally, one shouldn't overstate the greenness of our landscape.
Discontinuous urban fabric assumes between 50% and 80% of the land is built on, but we have taken the most conservative assessment of 80%. We have also assumed that 100% of continuous urban fabric is built on, even though it may be as low as 80%.
Interestingly, the UK NEA thinks our urban landscape is much greener than that, calculating that only 21% of our towns and cities is built on.
Using our much higher assumptions, 5.9% of the UK is built on and 2.5% is what might be called green urban - parks and gardens, golf courses and sports pitches.

The London borough of Richmond upon Thames has the highest proportion of "green urban" landscape anywhere in the UK. More than 58% of the local authority falls into this category: Richmond Park covers some 2,500 acres (10 sq km), and there are a number of large golf courses in the area.
3: The local authority with the greatest proportion of land devoted to golf is Woking. How much?
A: 11%
Overall, British golf courses are calculated to cover 1,256 sq km, an area roughly equivalent to the whole of Greater Manchester and, according to some estimates, just a little smaller than all the land covered by housing.
4: How much of the Lake District is lakes?
A: 3%
The psychological impact of a ghastly eyesore or a beautiful natural feature can lead us to assume it is physically bigger on the landscape than detailed mapping will reveal. Visitors to the Lake District National Park will focus on the glory of Windermere and Ullswater stretching into the distance and imagine the landscape is predominantly lakes.
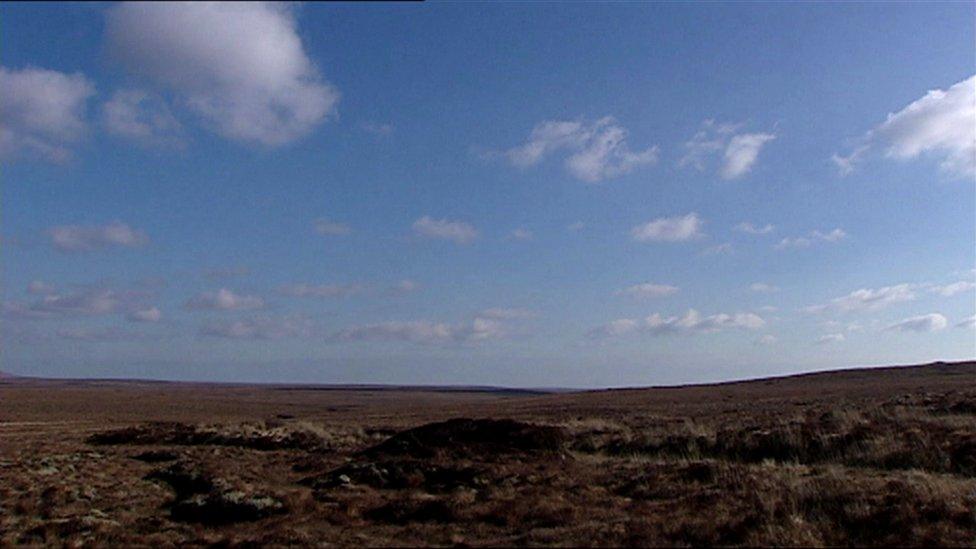
The land cover few of us encounter or notice is disregarded. That's the story with sphagnum moss, the key ingredient of peat bog.
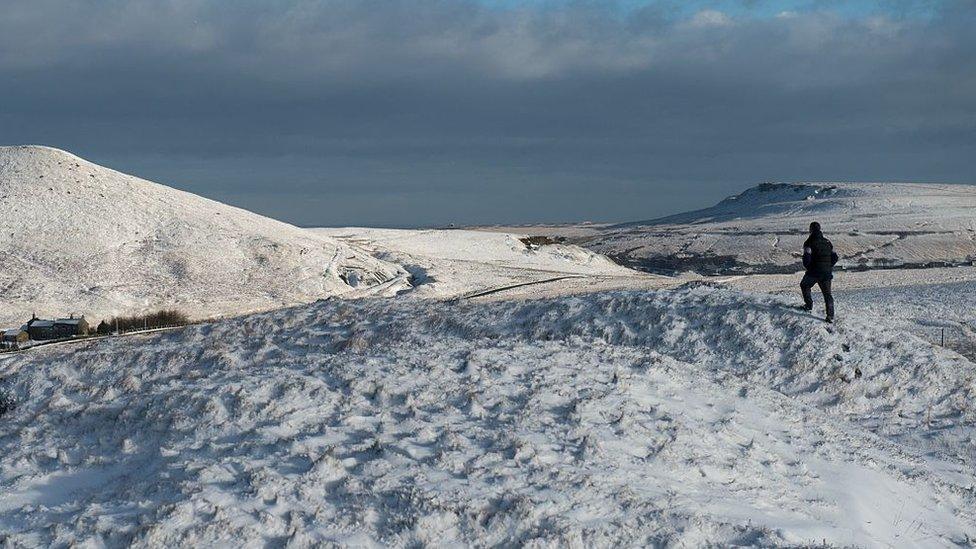
The peat bog capital of the UK is Na h-Eileanan Siar, Outer Hebrides, where 61% of the land surface is just that.
5: What proportion of the UK is peat bog?
A: 9.4%
Surprising though it may seem, there is almost 100 times as much peat bog in the UK as there is continuous urban fabric. Peat bog covers almost seven times as much land as all Britain's buildings.

The city of Bradford, in West Yorkshire, for example, is 0.3% CUF but 11% peat bogs. This is, of course, a factor of boundaries - the local authority area includes a chunk of the Yorkshire Dales.
But it is also a reminder that places designated as urban can have responsibility for important "natural" habitats. To be clear, a quarter of the Bradford Metropolitan Borough Council is built on - so your eyes don't entirely deceive you.
We have used the term "natural" to encompass land uses that are not principally farmed or urban, but humankind's impact can be detected on almost every patch of the UK.
Even the peat bogs of Yorkshire are managed, with water engineers ensuring the moss doesn't dry out and, on occasion, introducing sphagnum to areas that have previously been drained.

Are barley fields or Kew Gardens or a reservoir bird sanctuary or a golf course or grazed moorlands or a national park any more "natural" than a new housing estate or airport?
There is clearly a balance to be struck between the human need for homes to inhabit, food to eat, air to breathe and space to play against a wider responsibility for the natural world.
To help encourage this important debate, we have published a land use map for every local authority in the UK, dividing each one into the four groups mentioned:
agricultural
natural
built on
green urban
You can find out the story in your neighbourhood at the click of a button.
Your browser does not support this Lookup

If you can't see the area search, click or tap here, external.

But, if you want more detail, all the original local authority mapping data is available in A Land Cover Atlas of the United Kingdom, external by Alasdair Rae, from the University of Sheffield, who has also been enormously helpful in producing our online maps, external and quiz questions.
Methodology
The largest component of the "built on" category is "discontinuous urban fabric", within which 20-50% of the surface area may be green space. To account for this we have reassigned the minimum 20% of "discontinuous urban fabric" to "green urban", which in many cases may be an underestimate. The map uses building land cover data from Ordnance Survey.
Produced by Will Dahlgreen. Design by Prina Shah. Development by Evisa Terziu.