How wealthy is your neighbourhood?
- Published
- comments

Households in the wealthiest area of England and Wales have an average disposable income four times that of the poorest, according to Office for National Statistics estimates., external
The average figure in Mickleover North, in Derby, in 2017-18 was almost £40,000 more than in St Matthews and Highfields North, Leicester, estimates suggest.
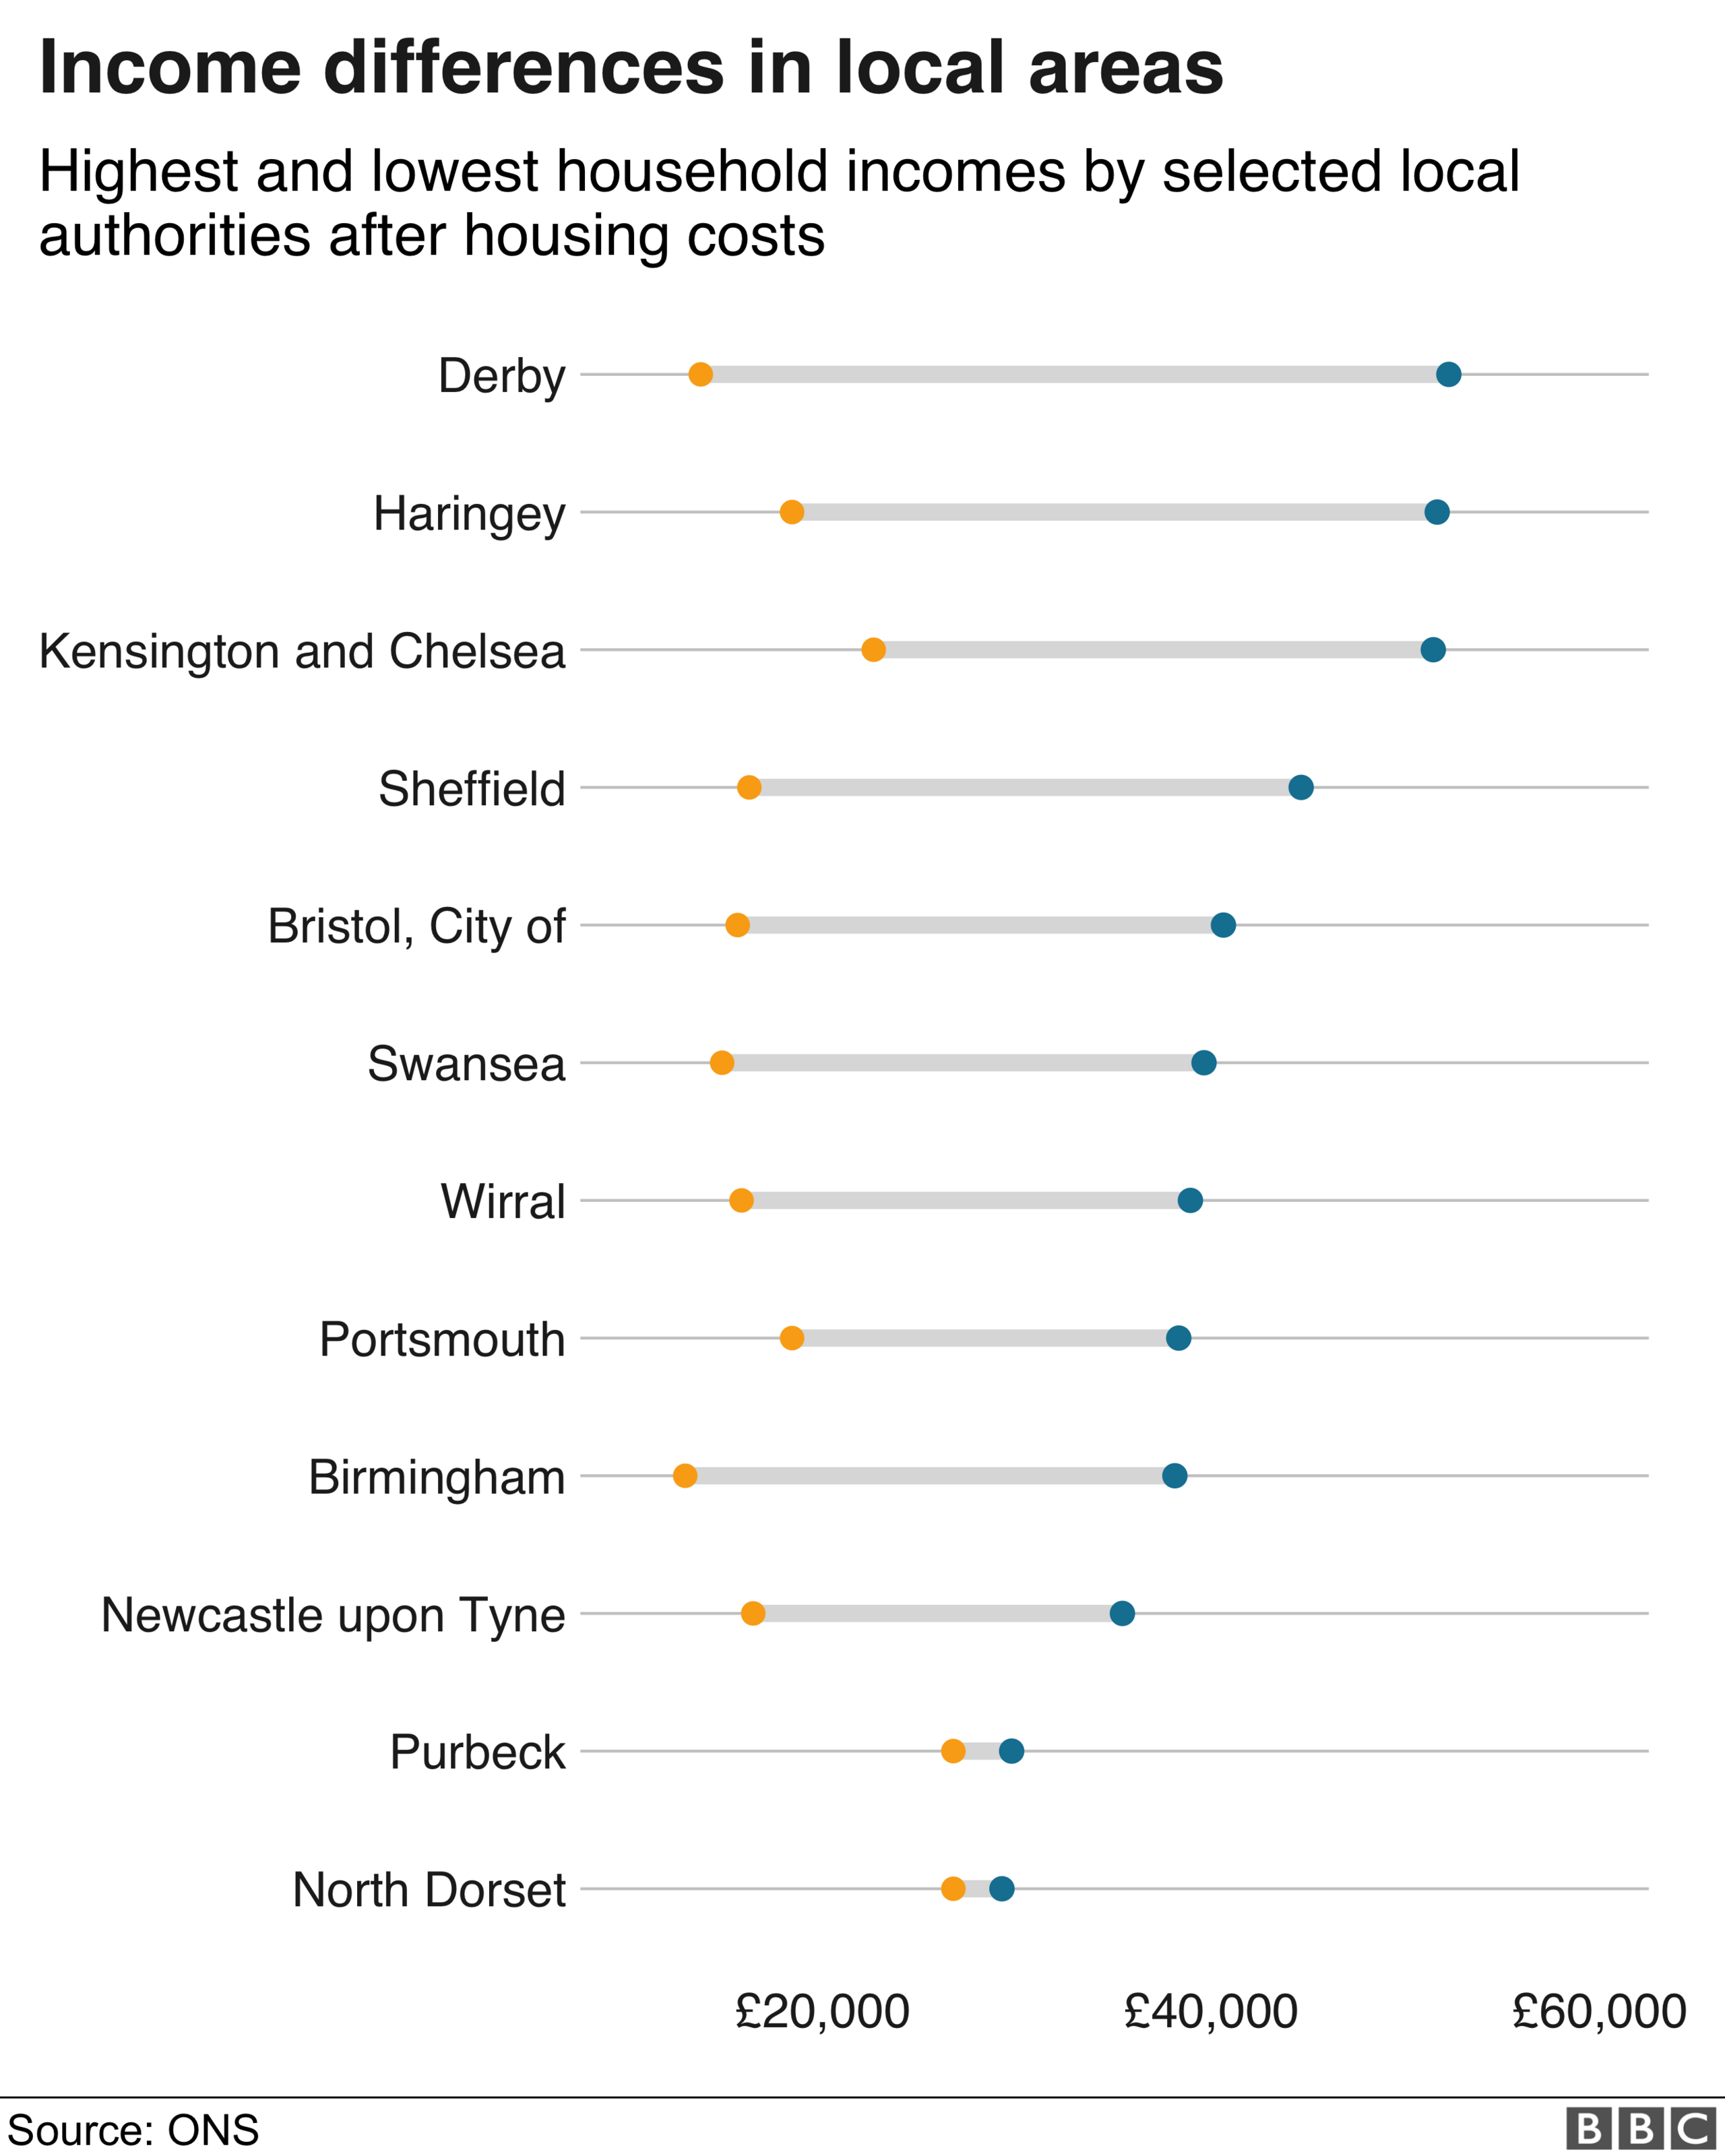
Derby also had the widest income gap between its richest and poorest areas.
London and south-east England had the highest proportion of wealthy areas.
Sorry, your browser cannot display this map
A quarter of London's local areas and a fifth of those in the South East were ranked in the top 10% of wealthiest areas.
In contrast, in north-west England, a fifth of its local areas were in the bottom 10% for household incomes.

Highgate East, Haringey and Queen's Gate, Kensington and Chelsea, were the only other local areas - apart from Mickleover North - with average household incomes over £50,000.
In Wales, the area with the highest income was Sketty, in Swansea, where the average is estimated to be £39,600.
This relatively high income led Swansea to have the highest divide between the most and least affluent areas in Wales.
The latest ONS figures look at net household income, which is income after certain taxes have been removed and includes welfare payments.
In order better to reflect living standards, they have been adjusted to take into account the size of each household and are based on a variety of data types, including surveys.
Income inequality
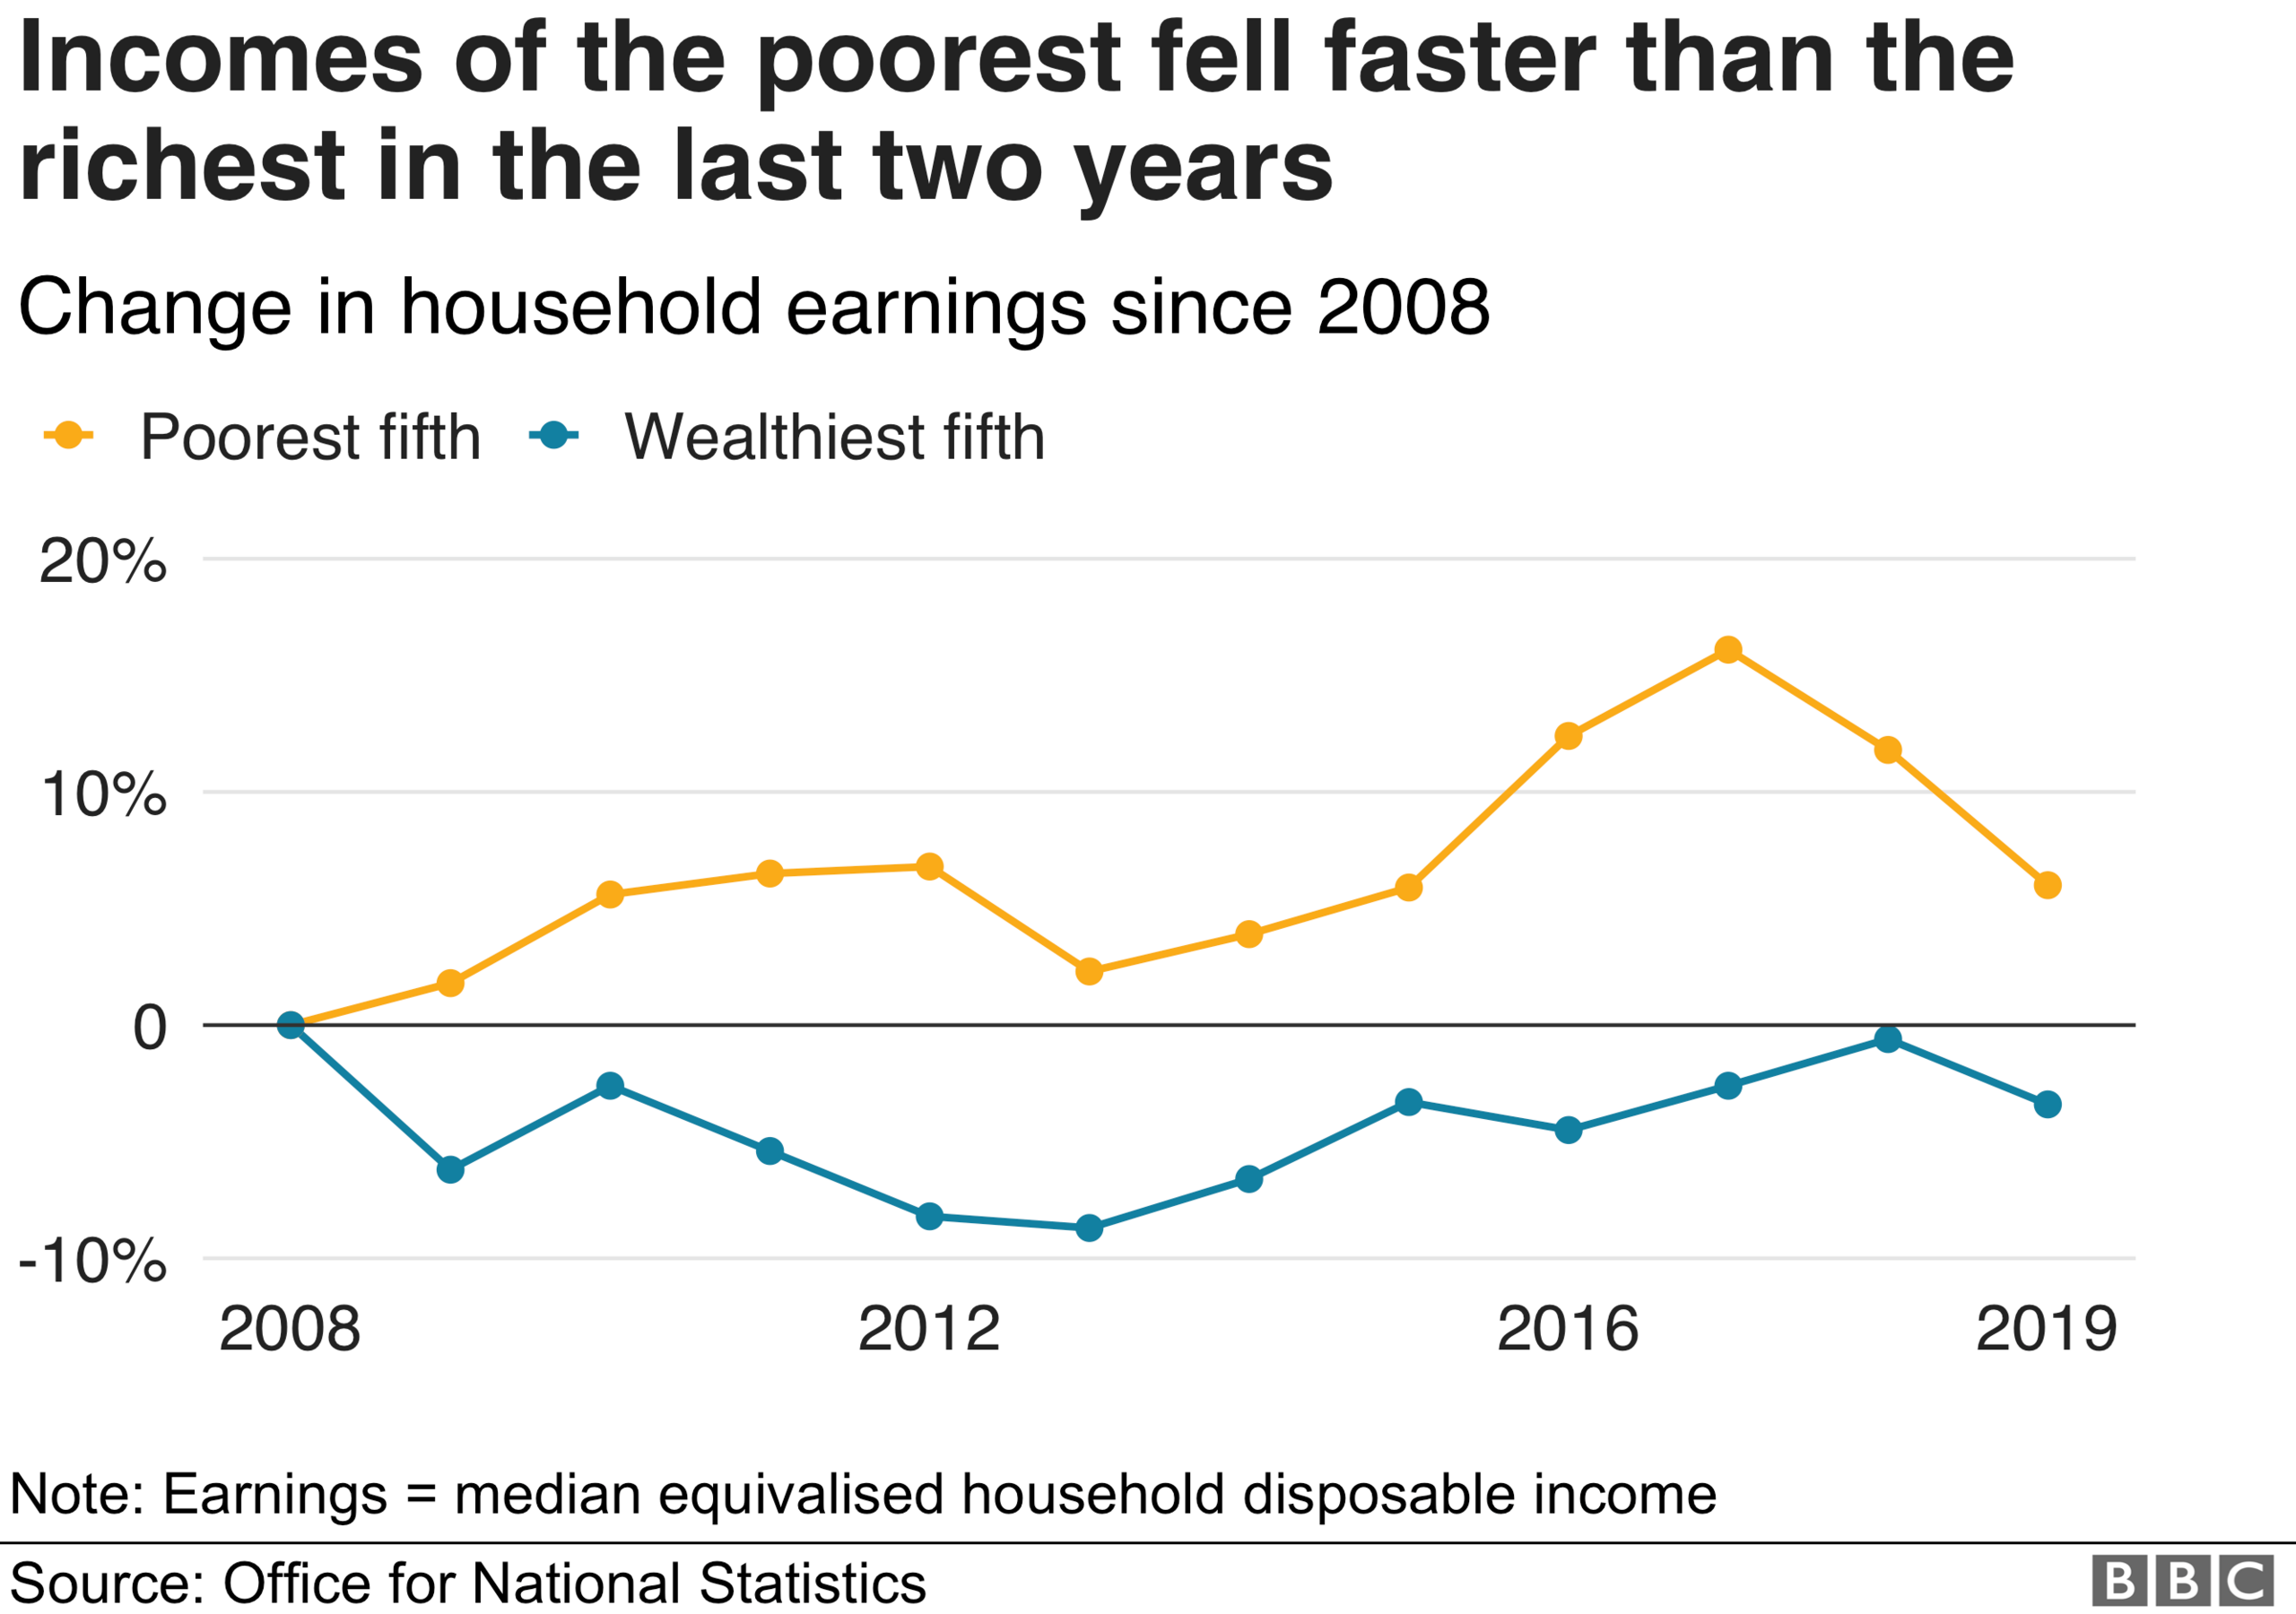
In a separate publication, ONS figures show that the household income inequality across the UK has increased slightly over the two years to March 2019.
Income for the poorest fifth of households fell by 4.3% a year, following four years of growth.
The wealthiest fifth had a smaller decline in average income and their incomes still haven't returned to their pre-2008 crisis levels.

Across all incomes, the average rate is still increasing but more slowly than before.
The figures highlight the size of the challenge the government faces in its bid to "level up" the country as new Chancellor Rishi Sunak prepares to unveil plans in his 11 March Budget for further investment to reach the people ministers have described as "left behind".
The latest figures estimate average income across the UK - before housing costs - is £29,600.
Adam Corlett, senior economist at the Resolution Foundation think tank, said: "Today's ONS data lays bare the incredibly weak living-standards growth the UK has experienced in recent years, contributing to a lost decade of income growth.
"The income squeeze, which abated in the mid-2010s, has returned in recent years. The new stagnation has affected households of all kinds, but the recent squeeze has been much worse for poorer households, who have seen big living-standards falls."
Inequality still remains lower than in the four years running up to the economic crisis in the 2008.
Then, the income share of the top 1% was around 8.8%, compared with 7.6% now.
Location names for local areas taken from Parliament.uk