Covid-19 case rates and vaccine rollout for Bedfordshire, Buckinghamshire, Cambridgeshire, Hertfordshire and Northamptonshire
- Published

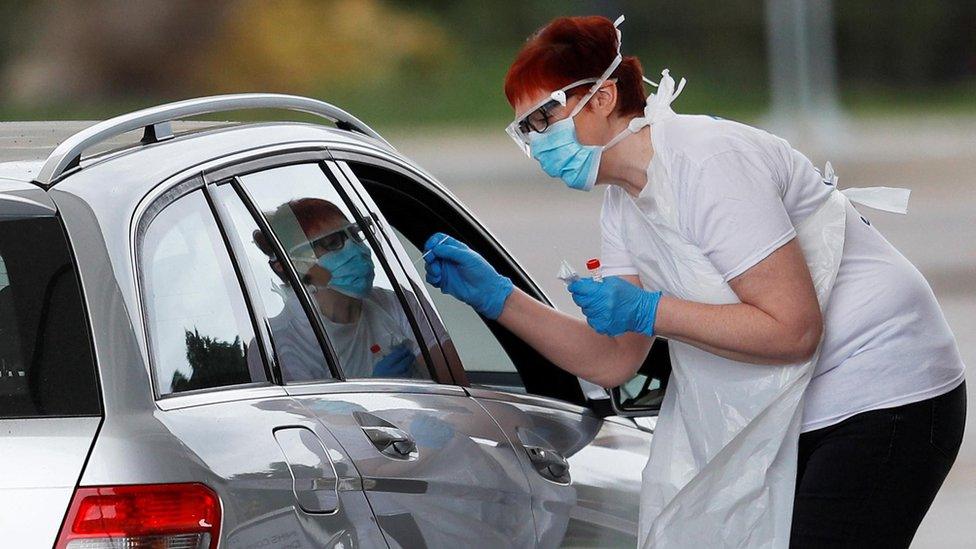
Corby in Northamptonshire has the highest Covid-19 rate in England, according to the latest figures
There have been more than 4.3 million confirmed cases of coronavirus in the UK and nearly 130,000 people have died, government figures show.
However, these figures include only people who have died within 28 days of testing positive for Covid-19 and other measures suggest the number of deaths is higher.
Two households or groups of up to six people are now able to meet outside in England again as the stay-at-home Covid restrictions order comes to an end.
The prime minister said four conditions must be met at each phase of lockdown easing - including the vaccine programme continuing to go to plan and infection rates not risking a surge in hospital admissions.
Vaccination rollout
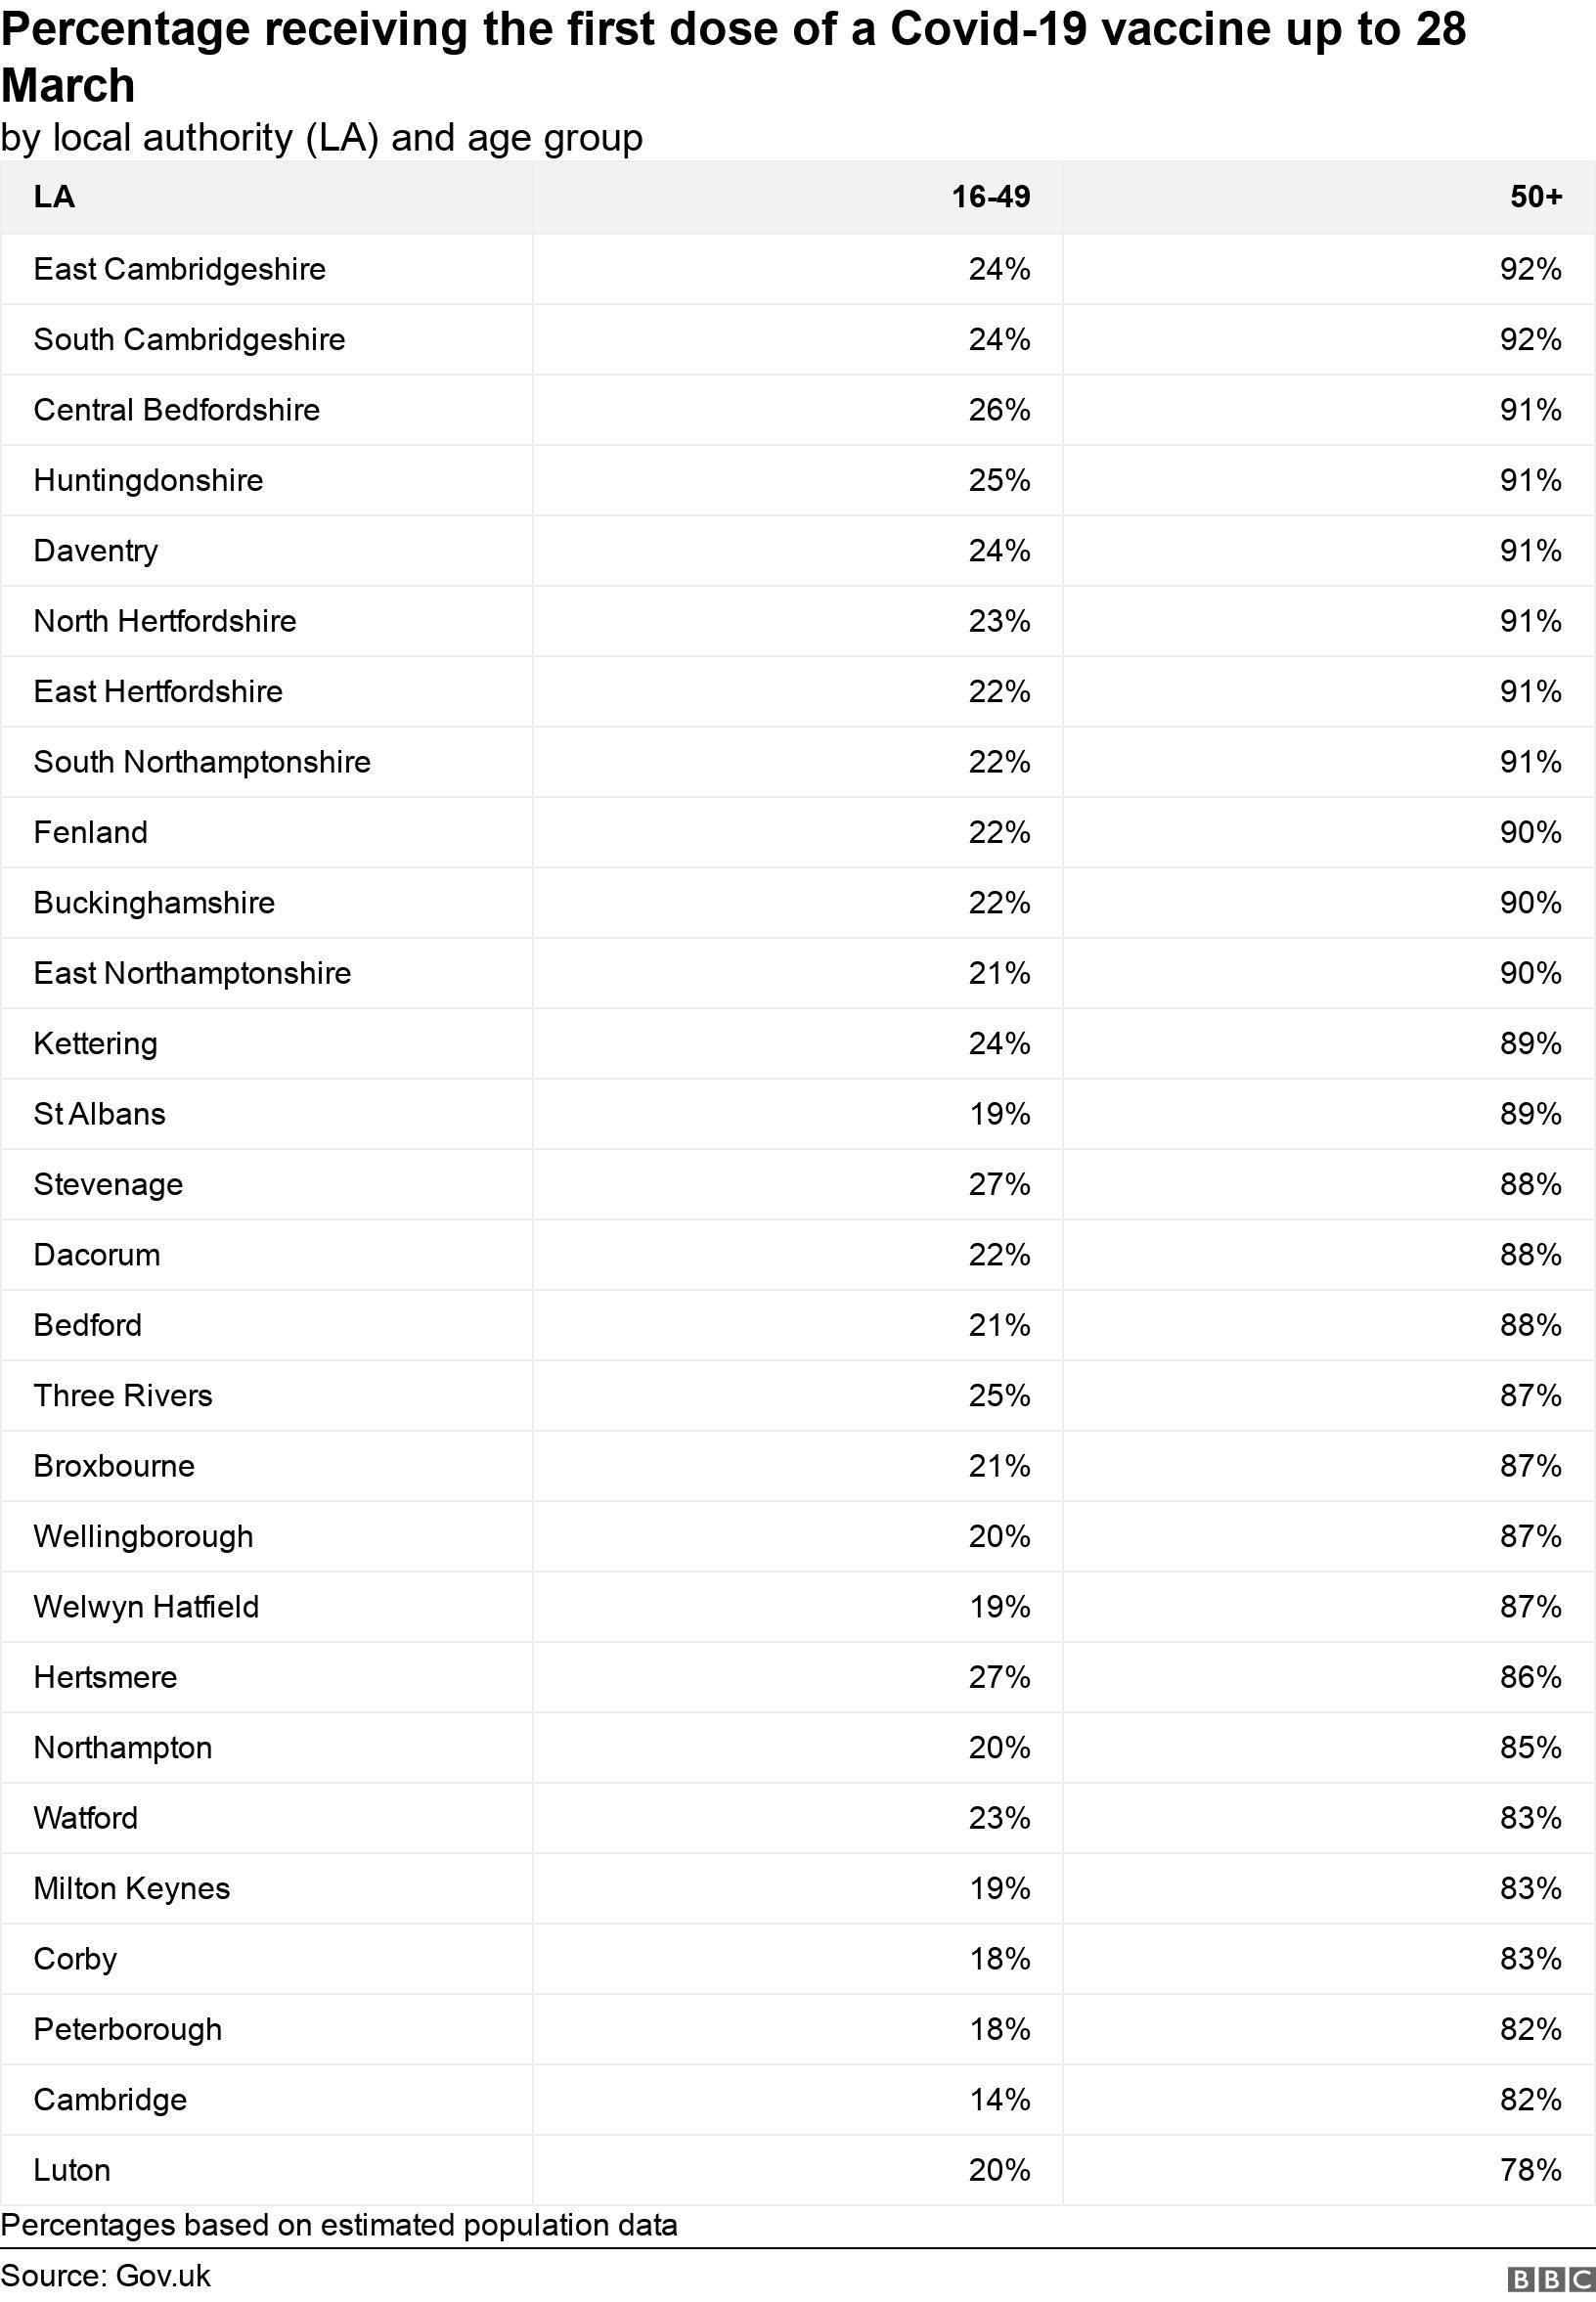
The proportion of over-50s who have received the first dose of a Covid-19 vaccine was more than 80% in almost all of the region's local authority areas.
Below is a table showing the percentage of over-50s who have had their first dose up to 28 March.
The percentages are calculated using vaccine data from NHS England and estimated population figures from the Office for National Statistics.
Case rates
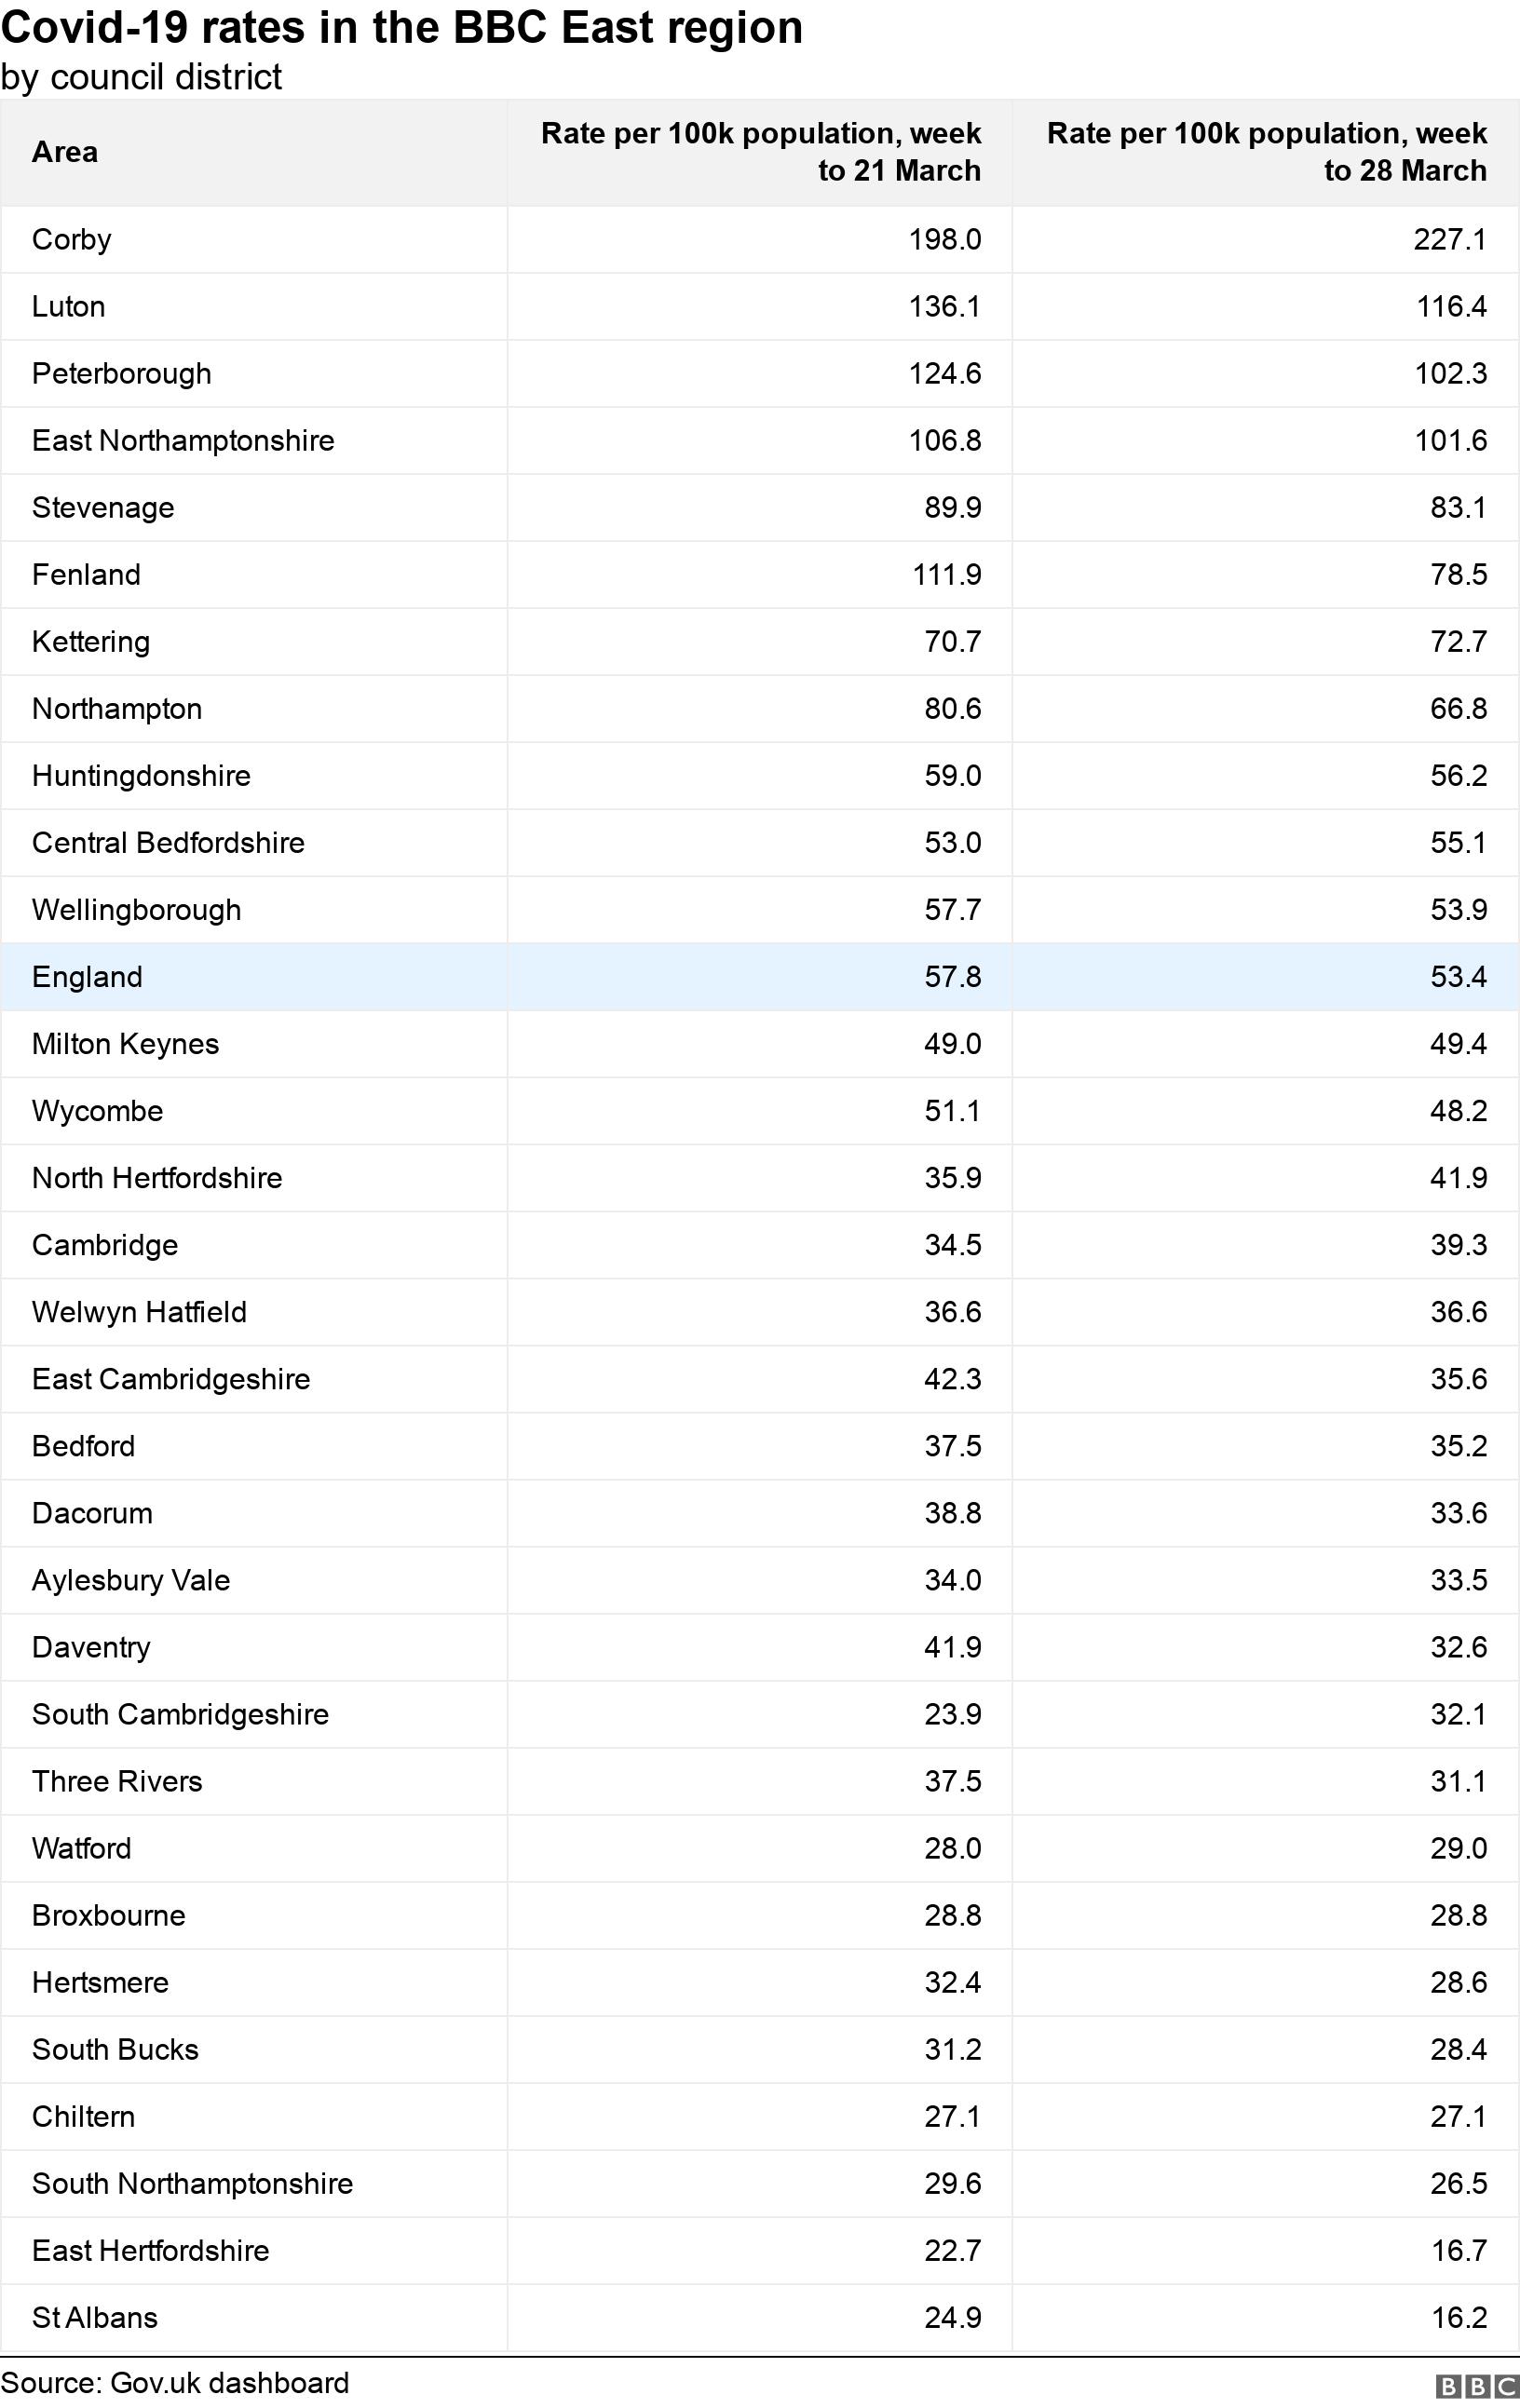
According to the latest infection rate figures, in the week to 28 March, Corby in Northamptonshire had the highest case rate for any district in England with 227.1 cases per 100,000 people.
This was a 15% increase on the previous week, with Kettering the only other district in Northamptonshire to see a rise.
Luton had a 14% week-on-week fall in case rates to 116.4 per 100,000 people, the 14th-highest in England.
In Buckinghamshire, only Milton Keynes had a rise in case rates, while Central Bedfordshire, Cambridge and South Cambridgeshire also had rises.
In Hertfordshire, there were week-on-week rises in case rates in North Hertfordshire and Watford.
Below is a table showing the rate of cases by council district in the week to 28 March, and the figure at the same point a week before.
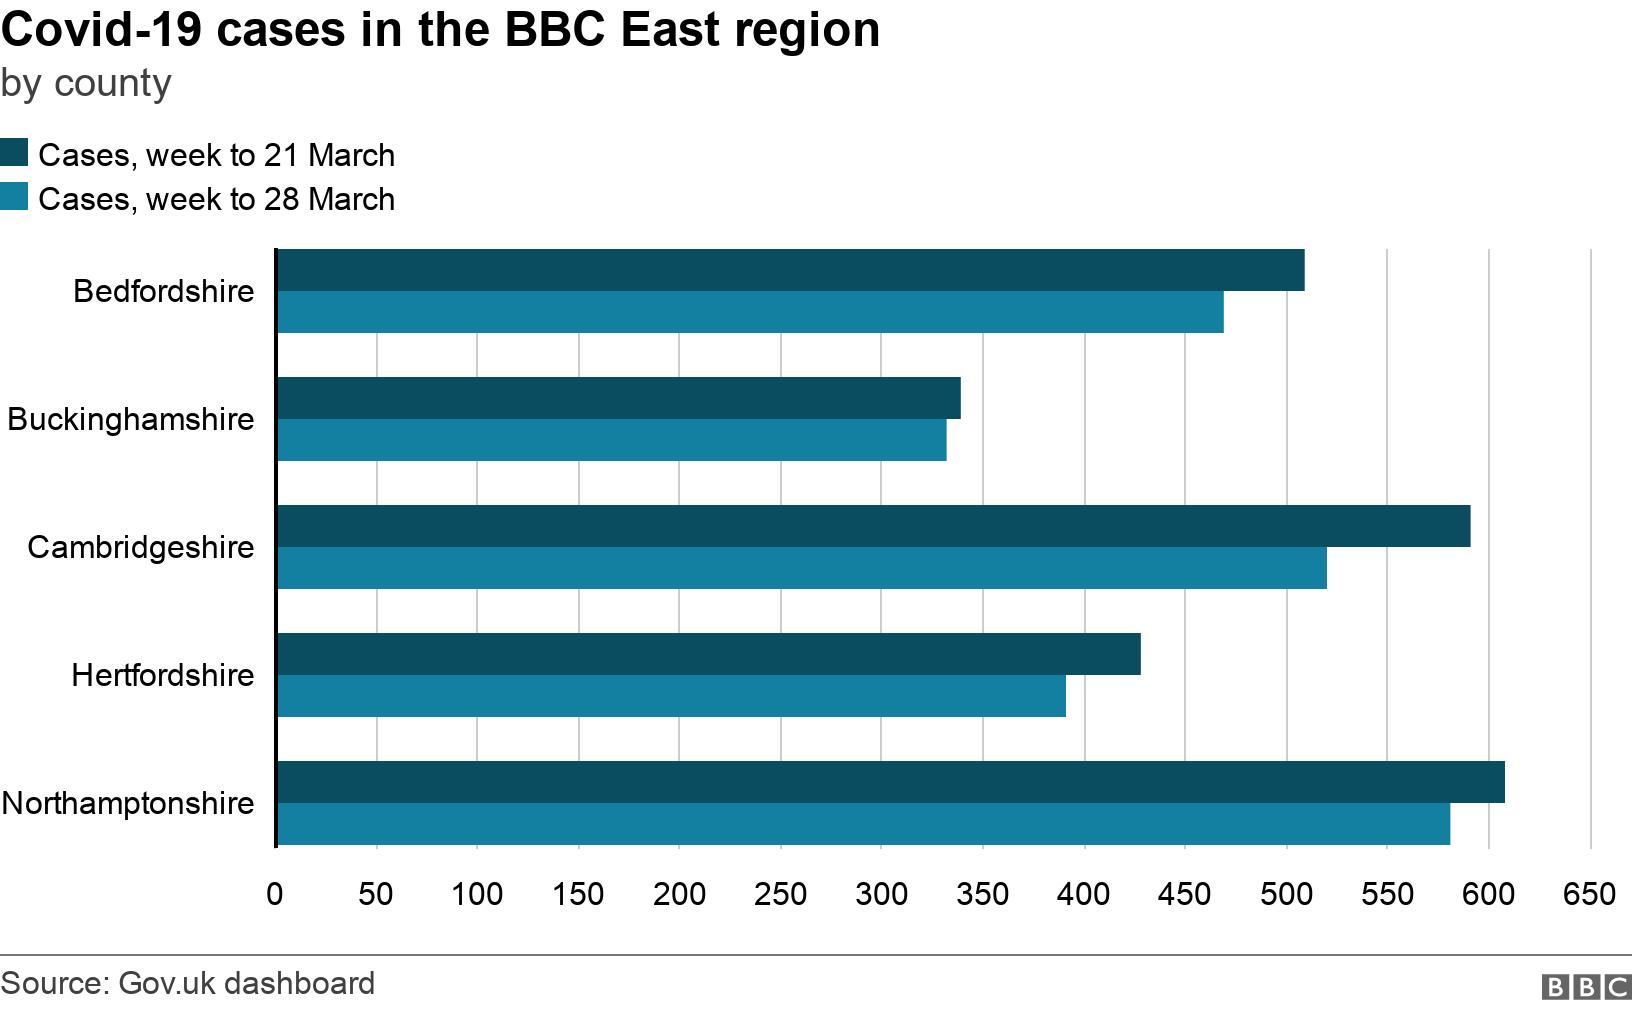
Below shows how many people tested positive for coronavirus in the week to 28 March per county, and the figure for the previous week.
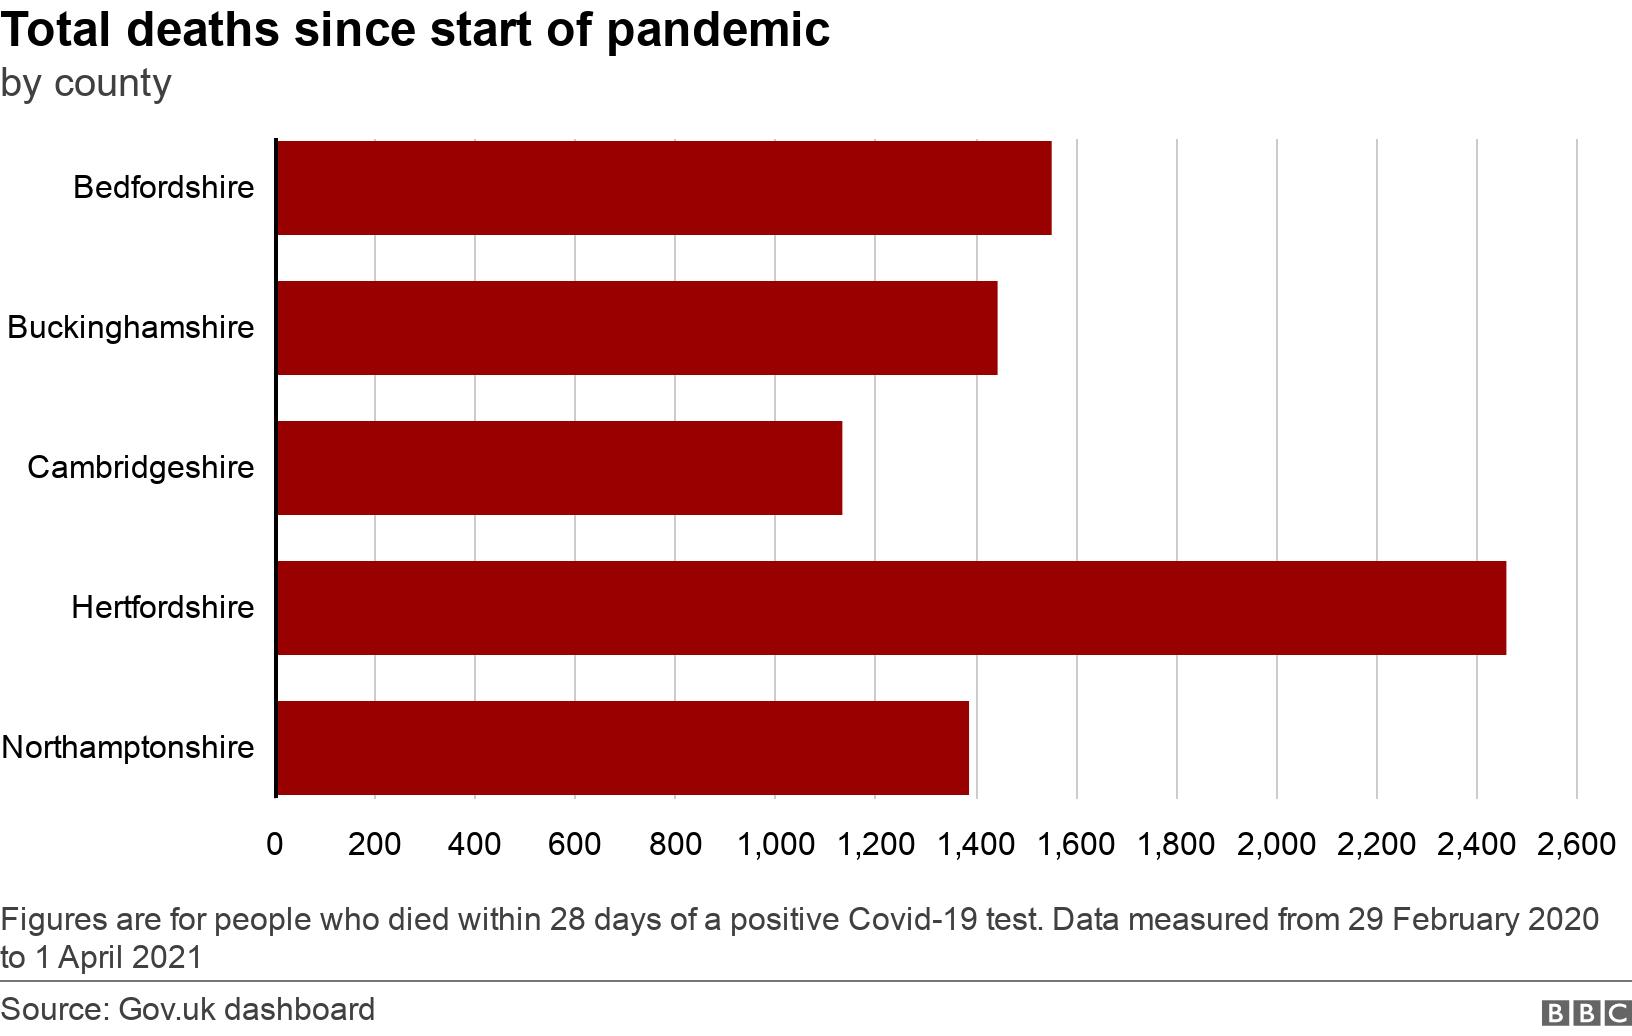
The table below shows how many people have died with coronavirus since the start of the pandemic.
Click here for the latest figures for Norfolk, Suffolk and Essex.
For a more detailed look at coronavirus where you live, use the BBC's postcode checker:

Or you could use this interactive map to check your district:
Sorry, your browser cannot display this map

Find BBC News: East of England on Facebook, external, Instagram, external and Twitter, external. If you have a story suggestion email eastofenglandnews@bbc.co.uk, external
- Published5 July 2023
- Published26 January 2022
- Published5 July 2022

- Published3 May 2022

- Published6 October 2021
- Published17 September 2020