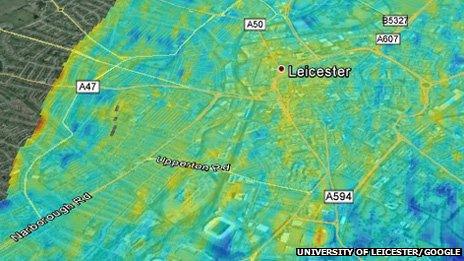
Map shows Leicester's pollution hotspots
- Published

Yellow and red indicate high levels of NO2 pollution, blue areas are the cleanest
Scientists have used pollution-detecting technology in a plane for the first time to map air quality around Leicester.
The University of Leicester used a new air quality measuring spectrometer to produce images of nitrogen dioxide (NO2) levels above the city.
Darker blue spots on the map showed the city's cleaner areas but polluted sites were highlighted in red and yellow.
NO2 comes mainly from traffic emissions and can cause respiratory illnesses.
Dr Roland Leigh, from the university's Earth Observation Science group, said:
"This is the first time in the UK anyone has been able to use airborne devices to map pollution levels across whole cities.
"This information really helps us understand the sources of pollution within cities, and the human exposure downwind."
Leicester railway station, the St Nicholas Circle roundabout, and junction 21 of the M1 were shown to be the more polluted areas.
The cleaner areas included Knighton Park, Leicester racecourse at Oadby and Western Park Golf Club.
The university said the results could help draw attention to polluted areas and help inform future environmental planning decisions.
The team eventually hopes to adapt the technology to use on spacecraft to monitor pollution levels across the whole planet.
- Published28 January 2013