London's healthiest streets rated on interactive map
- Published

Every road in London is given a rating on the Healthy Streets Index
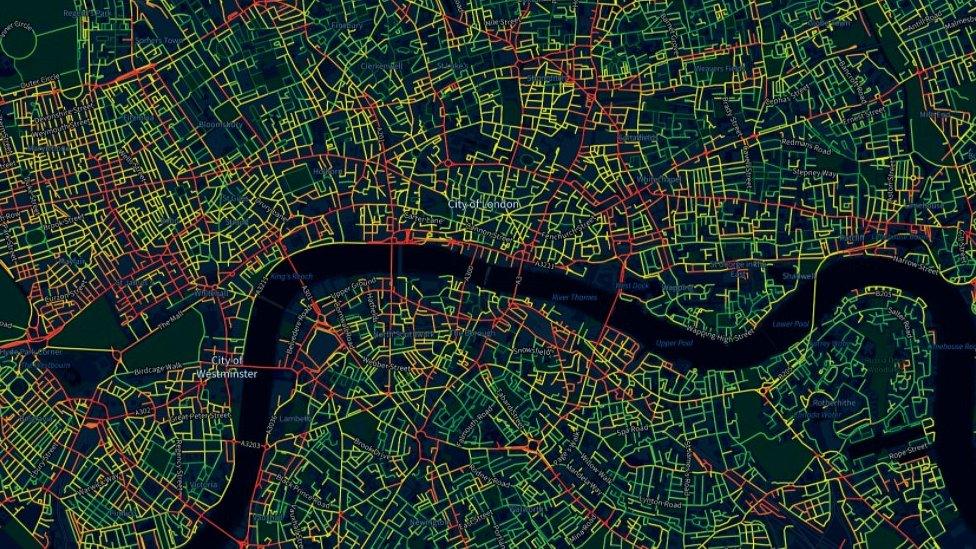
An interactive map which rates every street in London on how healthy a place it is has been launched.
The Healthy Streets Index, external uses aspects such as air and noise pollution, pavement space and number of trees to judge every road.
It has been created by experts from University College London (UCL), Healthy Streets and Tranquil City.
Its creators said it would allow Londoners "to make informed decisions about where we want to live".
Ten indicators known to have the biggest impact on health and wellbeing have been used to rate every street for the map and dataset.
In addition to pollution levels, aspects like access to services and public transport have been judged.

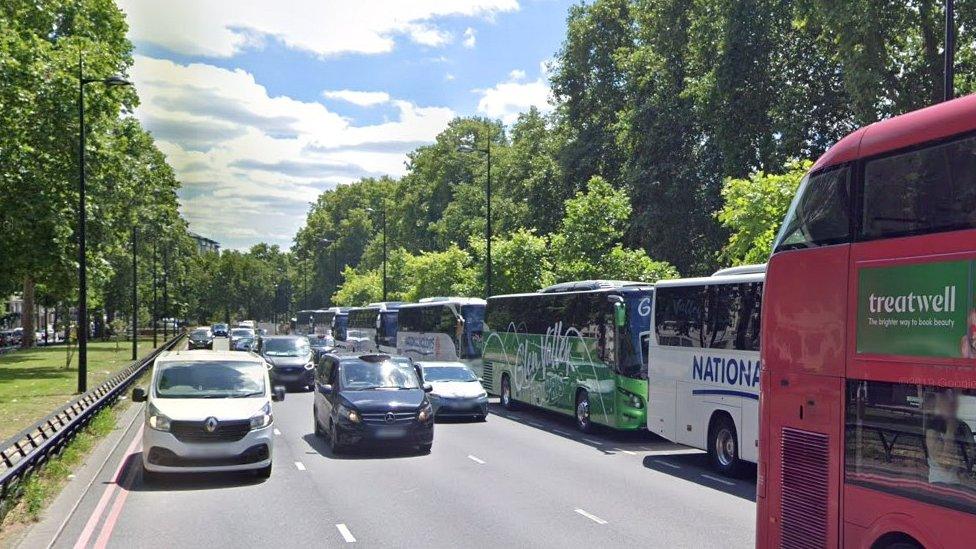
Park Lane, beside Mayfair, was rated in the bottom 5%
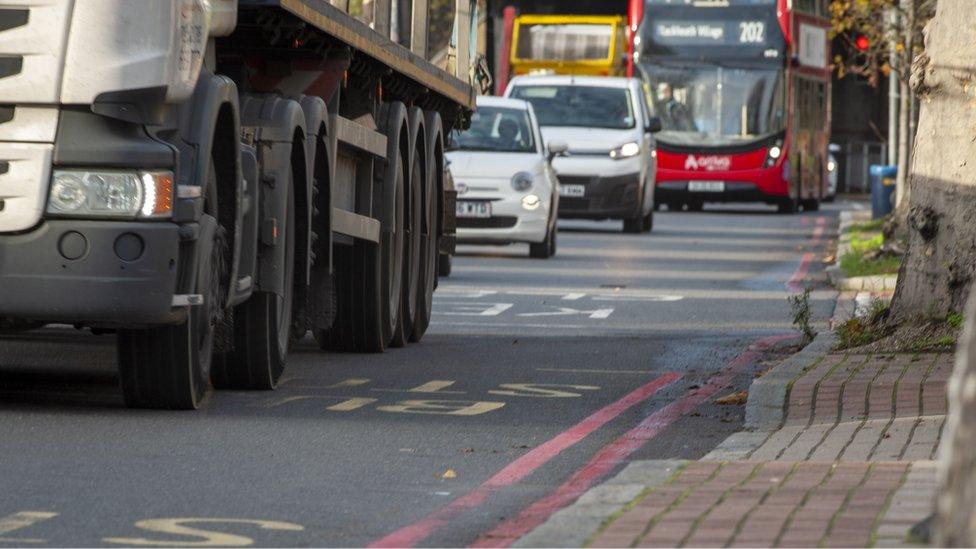
Park Lane and Brompton Road, two streets near central London that are well-known for being busy, are rated in the bottom 5% of London's roads.
There are also large variations between boroughs with Camden having one in six streets in the top 5%, while Bexley only has one in 500.
Hillingdon is rated as having the highest proportion of London's least healthy streets, with one in 14 in the bottom 5%.
The map's creators said they hoped people would use the data to help decide where they would live in the capital, as well as to plan daily activities.
Dr Ashley Dhanani, from UCL, said the index "offers a data-led view of the physical and experiential quality of our environments.
"This enables us to make informed decisions about where we want to live, the routes we take on everyday journeys and where improvements are needed to ensure everyone can live in the healthiest environments possible."

For more London news follow on Facebook, external, on Twitter, external, on Instagram, external and subscribe to our YouTube, external channel.
- Published17 December 2020

- Published1 April 2020
- Published25 June 2019