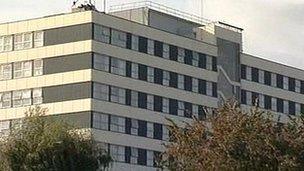
Barnsley hospital sick leave above average
- Published

Sick leave cost Barnsley Hospital NHS Foundation Trust £3m from September 2012 to August 2013
Barnsley Hospital staff took the highest number of days sick leave when compared with other South Yorkshire hospitals, an FoI request has shown.
Sick leave accounted for an average of 16.35 days between September 2012 and August 2013, up from 10.57 in 2010/11, at a cost of £3m.
National figures show the average for 2012 was 9.5 days., external
Barnsley Hospital has blamed stress at work and "musculoskeletal problems" for the figures.
Figures obtained by BBC Radio Sheffield under the Freedom of Information Act show that elsewhere in South Yorkshire the average sickness absence rate was 12.8 days.
Higher than desired
Sheffield Teaching Hospitals NHS Foundation Trust, which employs more than 15,000 staff, lost about £16m to staff sick leave in the same period.
Workers at the trust took an average of 14.36 days off - the second highest level in the region - up from 12.8.
In Rotherham the rate was 13.28 days, up from 12.54.
Doncaster was the only trust to see a drop in sickness absence from 11.4 to 11.2 days.
A spokesman for Barnsley Hospital said: "Our sickness levels are higher than we would want them to be and we are working hard to reduce them.
"We have seen our levels go up in recent years mainly because of increased levels of work-related stress and an increase in musculoskeletal problems."
The trust was providing training to staff in "resilience and how to cope better with work pressures" and had also introduced in-house counselling and physiotherapy services, he said.
Mark Gwilliam, director of human resources and and organisational development in Sheffield, said it was due to introduce an "early intervention support package" for staff suffering from musculoskeletal and mental health conditions in a bid to help them remain at or return to work.
BARNSLEY
Sick days per head Sept 2010-August 2011 = 10.57
Sick days per head Sept 2012-August 2013 = 16.35
Change 2010/11 - 2012/13 = +5.78
DONCASTER
Sick days per head Sept 2010-August 2011 = 11.4
Sick days per head Sept 2012-August 2013 = 11.2
Change 2010/11 - 2012/13 = -0.2
ROTHERHAM
Sick days per head Sept 2010-August 2011 = 12.54
Sick days per head Sept 2012-August 2013 = 13.28
Change 2010/11 - 2012/13 +0.74
SHEFFIELD
Sick days per head Sept 2010-August 2011 = 12.8
Sick days per head Sept 2012-August 2013 = 14.36
Change 2010/11 - 2012/13 = +1.5
ALL (AVERAGE)
Sick days per head Sept 2010-August 2011 = 11.08
Sick days per head Sept 2012-August 2013 = 12.85
- Published27 September 2013
- Published10 April 2013
- Published13 February 2012