Coronavirus: What we know about Northern Ireland's death toll
- Published

The Northern Ireland Statistics and Research Agency (Nisra) releases a weekly statistical bulletin giving information on deaths in Northern Ireland related to coronavirus.
The figures cover all fatalities where coronavirus has been recorded on the death certificate.
Here is a look at what the latest figures, external, published at 09:30 on 15 May 2020, tell us.

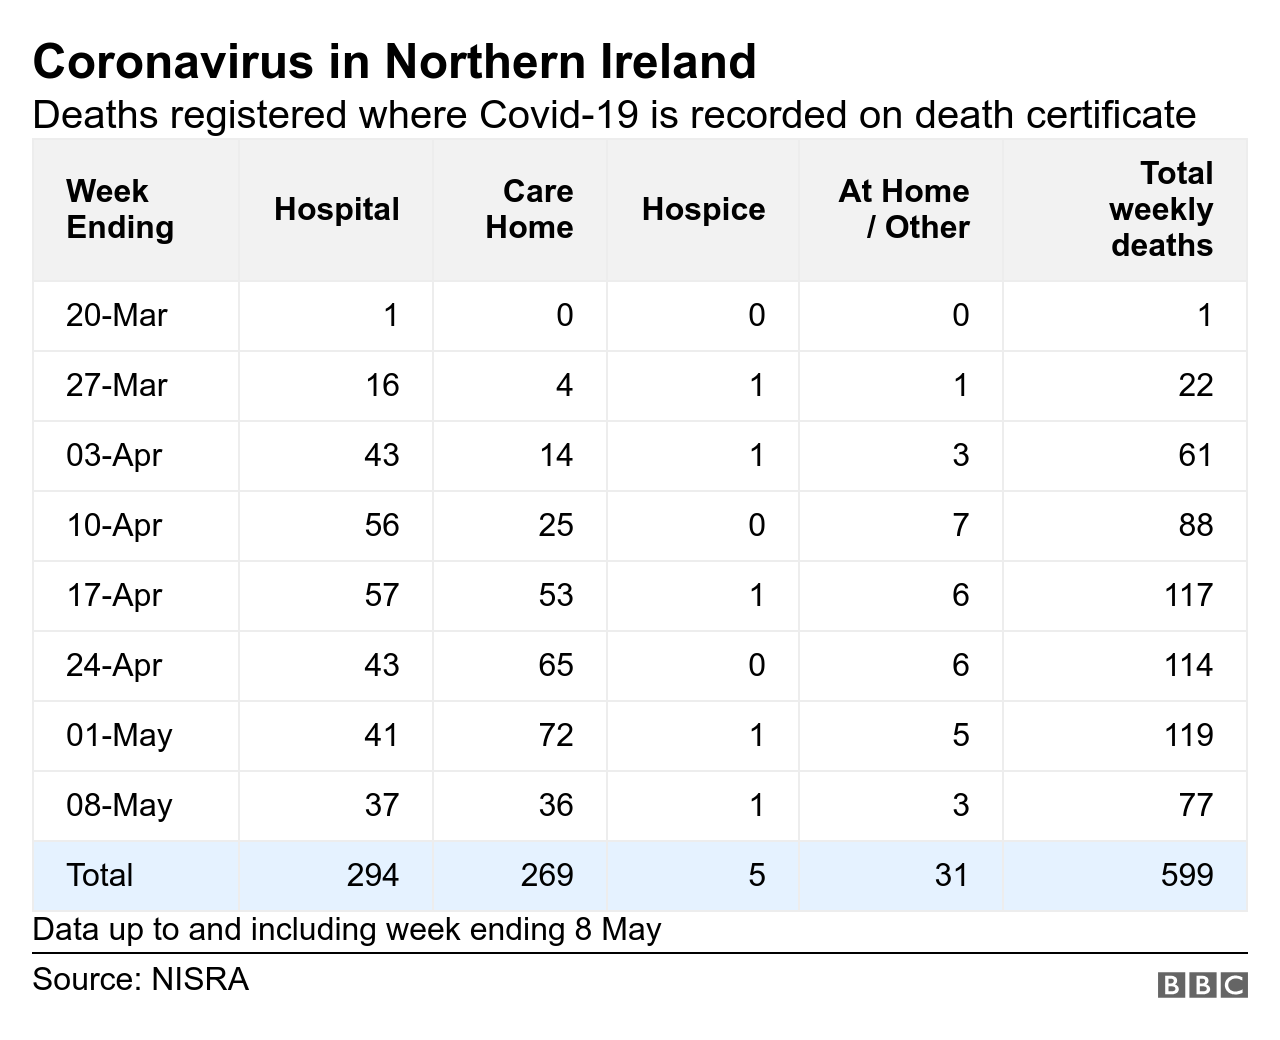
The latest figures show that 599 deaths had occurred by 8 May.

The bulletin says by last Friday, 294 deaths (49.1%) occurred in hospital; 269, or 44.9%, occurred in care homes, and five (0.8%) occurred in hospices.

In the week up to 8 May, there were both a total of 289 male and 289 female coronavirus related deaths.

People aged over 75 accounted for more than three-quarters of all Covid-19 related deaths in Northern Ireland.

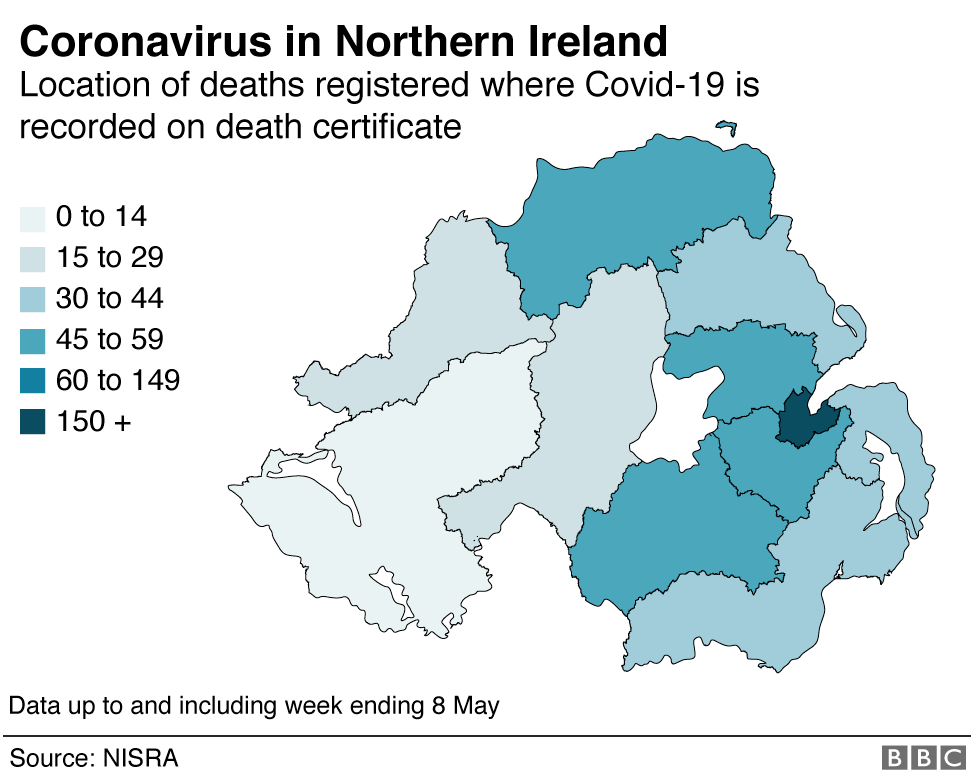
Of the 11 councils, Belfast had recorded the most deaths, 173, while Fermanagh and Omagh had the fewest deaths, recording 16 by 8 May.

The total number of all deaths registered in Northern Ireland in the week ending 8 May was 336; falling from 427 in the previous week - but still higher than what would be expected at this time of year.


A SIMPLE GUIDE: How do I protect myself?
AVOIDING CONTACT: The rules on self-isolation and exercise
WHAT WE DON'T KNOW How to understand the death toll
TESTING: Can I get tested for coronavirus?
LOOK-UP TOOL: Check cases in your area

- Published24 April 2020

- Published20 April 2020

- Published15 April 2020

- Published15 April 2020

- Published15 May 2020
