Covid-19: What is the current picture shaping the roadmap?
- Published
The Northern Ireland executive released its road map for getting out of lockdown during the week.
Unlike plans announced in England, it did not include any sort of timetable.
Neither were there any targets for things like infection rates, hospitalisations or intensive care occupancy.
Undoubtedly, these will be among the issues that our politicians will have to consider when it comes to making decisions about when and at what pace to unlock.
But what's the picture at the minute?
Infection rates
On Good Morning Ulster on Wednesday, Deputy First Minister Michelle O'Neill raised a few eyebrows with a claim about Northern Ireland's Covid case numbers compared to those in Great Britain.
Speaking about the case numbers in the context of the roadmap out of lockdown, Ms O'Neill said: "If you compare what's happening in England, Scotland, Wales, our cases here are still much, much higher, even though we're on a downward trajectory and that's obviously a very positive thing."
But was she right?
The prevailing narrative in the new year has been that case numbers in Britain have been comparatively higher than those in Northern Ireland.
However, the number of cases - and therefore, the infection rate - has been falling right across the UK and Ireland over the past few weeks.
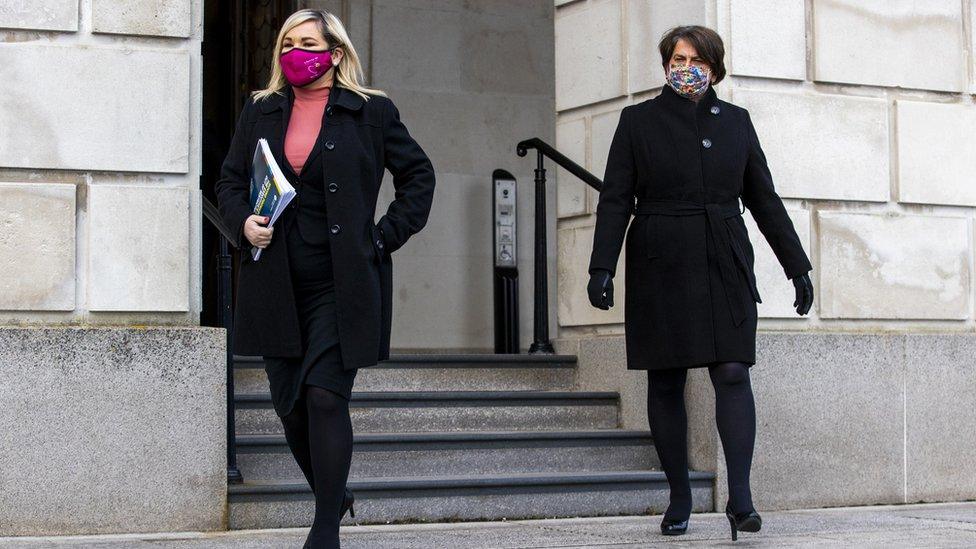
Michelle O'Neill and Arlene Foster outlined the plan at Stormont on Tuesday
One way of measuring the case rate is to calculate a seven-day rate per 100,000 population.
On this basis, Northern Ireland did indeed have the worst case rate in the UK at the time that Michelle O'Neill spoke. But only just.
These were the figures for that seven-day population-based rate at the time:
NI - 78/100k population
England - 73/100k population
Scotland - 72/100k population
Wales - 45/100k population
Yes, Northern Ireland had the highest. But the difference between its rate and England's and Scotland's was very small. Certainly, Northern Ireland did not have case numbers that were "much, much higher" than Britain's.
And these rates can change quickly - especially for Northern Ireland, given our small population size. Here are the same rates just 48 hours later:
NI - 64/100k population
England - 57/100k population
Scotland - 66/100k population
Wales - 51/100k population
To add to the comparison, the entire UK has lower case rates than the Republic at the minute - the comparative rate there is 84/100k population.
However, the key phrase is 'at the minute'. In a week's time - depending on virus spread and positive test results - these figures could be drastically different, for the better or the worse.
BBC News NI contacted Sinn Féin to ask about the data on which Ms O'Neill made her assertion. We have received no reply.
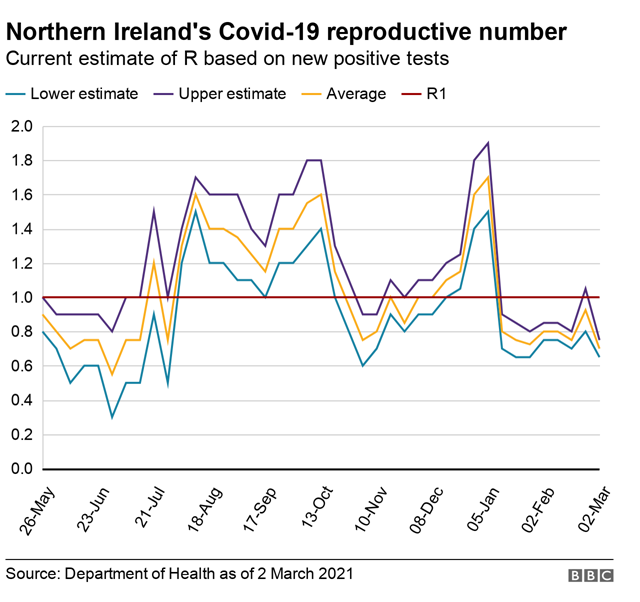
Looking at longer trends, the infection rate is broadly continuing to fall across Northern Ireland.
The R number - the rate at which the virus is thought to be spreading - has dropped to between 0.65 and 0.75; data from the Public Health Agency indicates falling numbers of clusters and outbreaks of Covid.
At previous points in the pandemic, authorities have introduced restrictions once infection rates have exceeded the mark of 200 cases per 100,000 population. No council areas in Northern Ireland are at this level, but some more localised areas still do exceed it.
According to figures from the BBC's Data Unit for the week up to 25 February, some council areas in Northern Ireland have seen slight increases in infection rates - including Lisburn City and Castlereagh; Belfast; and Derry City and Strabane.
Mid and East Antrim has seen an increase in its infection which has pushed it to being the second worst infection rate in Northern Ireland behind Mid Ulster - at 126 cases per 100,000 population; and 134 cases per 100,000 population respectively.
This increase in Mid and East Antrim's infection rate looks to be driven by a spike in infections around the Ballymena area.
Still, the infection rates in Northern Ireland's council areas remain relatively low compared to other council areas in the UK. While Mid Ulster has the worst in Northern Ireland, there are 71 council areas across the UK with worse infection rates.
Since the start of the pandemic, almost 6% of Northern Ireland's population has had the virus.
The Republic of Ireland calculates its infection rates over a 14-day period, rather than Northern Ireland's seven-day window, meaning they can't be compared directly.
However, the Republic's infection rates are roughly similar to Northern Ireland and they have been falling as well.
Hospitalisations
The number of people being admitted to Northern Ireland's hospitals has generally been on a downward trajectory for about six weeks.
The rolling average for admissions indicates that on any given day, fewer than 15 people can be expected to be admitted suffering from Covid-19. That's down from a peak of 94 in the middle of January.
This falling admission rate is reflected in the number of inpatients with the virus - now below 250 for the first time in about five months.
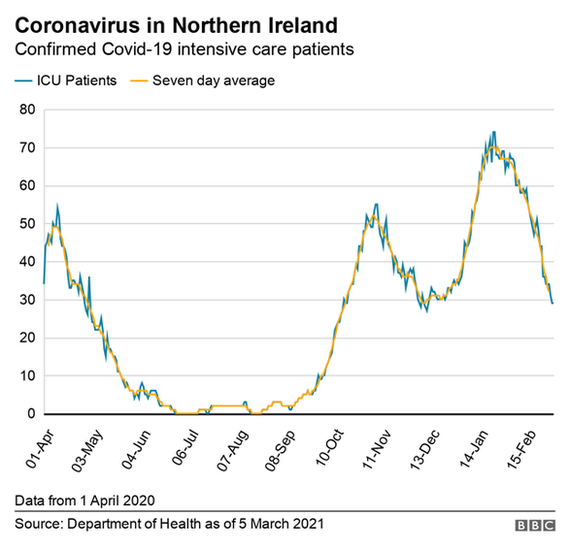
Intensive care units are still seeing plenty of Covid-positive patients (about a third of ICU patients have the virus), but this is greatly reduced from January.
Nearly all of the Covid patients in ICU are ventilated - meaning they are getting mechanical help to breathe.
Deaths
The Covid death rate has been decreasing in Northern Ireland over approximately seven weeks. We now have a seven-day rolling average of two deaths per day.
Over the course of the pandemic, Northern Ireland has not seen the same level of death as the rest of the UK. It has been lower, and much more in line with the death rate in the Republic.
And that remains the case. Once you put the seven-day rolling averages for the four nations of the UK into the context of population, it is clear that Northern Ireland still has the lowest rate. Scotland and Wales have rates close to Northern Ireland's. England's is much higher. The Republic's is somewhere in between.
Seven-day average death rates by 100,000 population:
UK - 0.37
Northern Ireland - 0.10
Scotland -0.21
Wales - 0.19
England - 0.97
Republic of Ireland - 0.30
During the week, Nisra released a report into excess deaths - those deaths above what would normally be expected. It makes for stark reading.
Between 1 March and 31 December last year, we had almost 2,000 more deaths than the five-year average would suggest we could have expected. A very similar number involved Covid.
The figures also showed that numbers of excess deaths were higher amongst the most well off, and that many people - who would have died in hospital in non-pandemic years - died at home.
Vaccinations
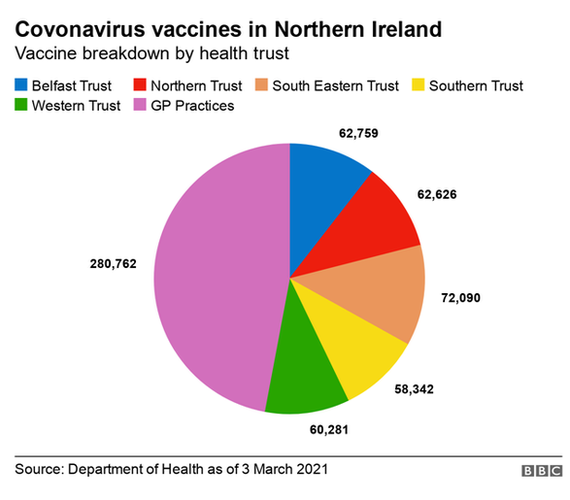
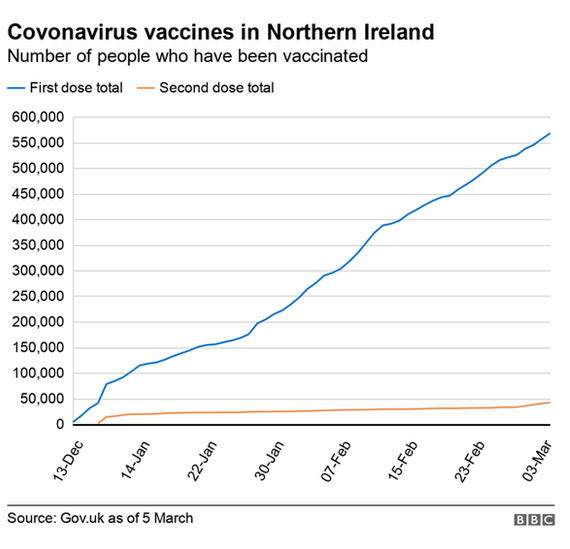
About 30 per cent of Northern Ireland's entire population has now had a first vaccination. That percentage rises to almost 40 per cent amongst the adult population.
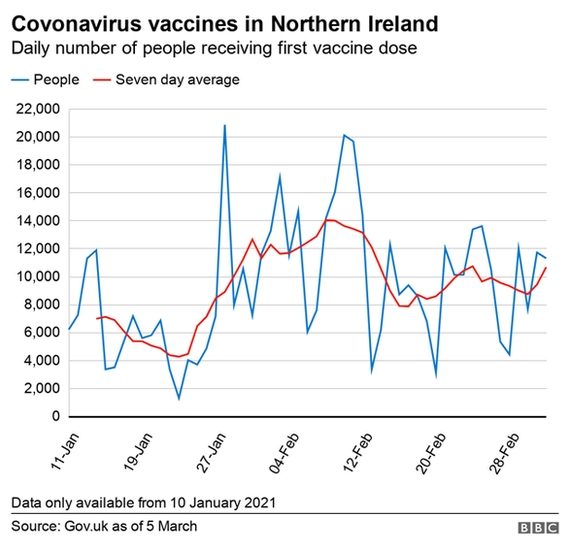
Given that the vaccination programme has been going for less that three months, that is impressive progress so far, albeit a little lower than the rest of the UK. The following reflects first doses:
Northern Ireland - 29.9% of overall population vaccinated
Wales - 30.9% of overall population vaccinated
England - 32.4% of overall population vaccinated
Scotland - 31.8% of overall population vaccinated
The Republic is still quite far behind the UK in terms of its vaccination programme - just over 6% of the population there has received a first dose.
Notably, Northern Ireland has very recently started to increase its rate of rollout of second doses of vaccine. This is understandable, given that it is about three months since the programme started, and the strategy is to deliver second doses within 12 weeks of the first.
The woman in charge of Northern Ireland's vaccination programme this week revealed that health officials in Northern Ireland are not yet in a position to assess the uptake of the vaccine amongst those people who have been eligible to receive it.
This type of information has been available in the other UK nations for some time now, and Scotland recently launched a part of its dashboard dedicated to data on the uptake of the vaccine.
BBC News NI has been requesting similar data from the Department of Health for a number of weeks.
Speaking to the BBC's Talkback programme on Thursday, Dr Patricia Donnelly said that there had been an "absence" of infrastructure to collate this data in Northern Ireland previously.
"We have been getting good information on a daily basis. So we are able to say how many people are vaccinated. We are able to say [about] those individual groups," she said.
"What we can't do is that analysis that we'd like. We expect that that's going to be the case in the next week or two. We'll have a regular flow of that information to be able to say what the uptake rates are like, maybe something about the geography.
"We do have good information now, but not the sort that would give us the sort of analysis - some of the analysis - that you're talking about."
Dr Donnelly also admitted that officials do not know the uptake rate of vaccine amongst healthcare workers:
"We wouldn't know the uptake rate. We just know the numbers, so we would be able to say that we think that there's overall a good uptake rate, but we know there's variation in places.
"So once we've got that analysis with the vaccine management system, we will be able to then target those areas where we think the uptake is low."
Related topics
- Published3 March 2021
- Published2 March 2021
