The Thatcher years in statistics
- Published
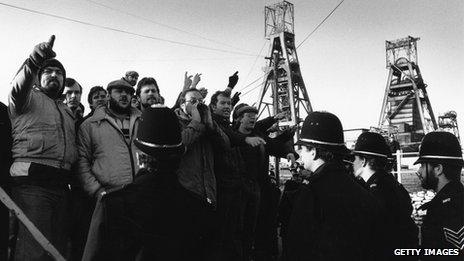
Margaret Thatcher's premiership was a time of immense social and economic change.
Elected just after the industrial unrest of the "Winter of Discontent", she embarked on a tough reform programme with the top priorities of tackling inflation and the unions.
She presided over a shift from centralised, state-controlled institutions to privatisation and economic reform.
But her policies divided the country as the service sector and home ownership boomed, but manufacturing declined and unemployment rose.
Below are some key indicators of Mrs Thatcher's years in power, May 1979 - November 1990, with the three preceding and following years for context.
Inflation
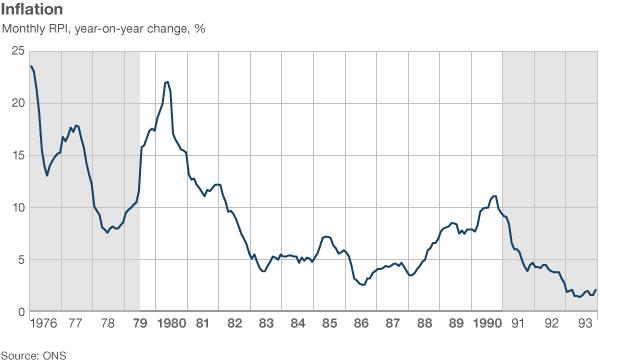
One of Margaret Thatcher's first goals was taming inflation which had reached dizzying heights of over 25% in the mid-1970s.
The incoming Conservative government raised interest rates sharply and brought in tough public spending curbs.
A recession followed and unemployment shot up. This also led to reduced wage demands and a slowing of the rate of inflation, although this crept up once more in the boom of the late 1980s.
Unemployment
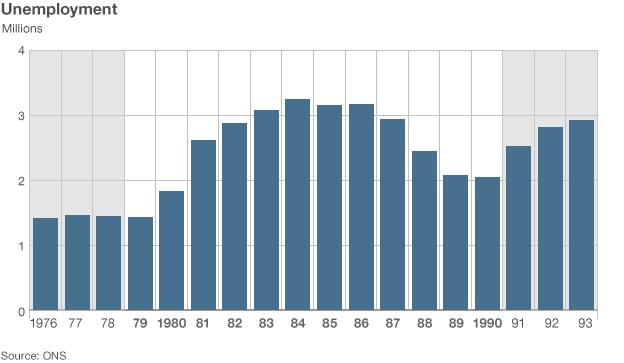
Unemployment had been rising throughout the 1970s as companies set about restructuring and modernising their businesses.
But it picked up speed after the Conservatives took power in 1979, rapidly rising to over three million out of work in 1983.
Unemployment hit hardest in Northern Ireland, where one in five people was out of work in the early 1980s, along with the industrial areas of northern England and Scotland.
An economic boom later in the decade helped to bring unemployment down, but it was a slow process.
Coal production
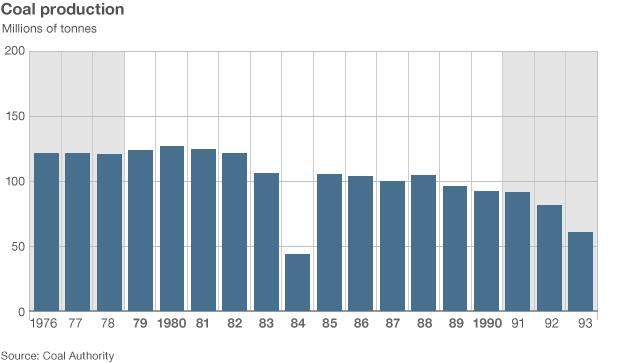
Against this backdrop of high unemployment, the Coal Board announced in early 1984 that 20 uneconomic pits would have to close, putting 20,000 miners out of work.
It was the government's second attempt to close these pits, after a climb-down in 1981.
Miners at the endangered Cortonwood colliery in Yorkshire walked out on 5 March 1984 in protest at the plans. Within a week, more than half the country's miners were on strike.
The dispute lasted a year and led to conflict not only with police but between miners who supported the strike and those who did not.
When the miners returned to work, the pit closure programme continued.
GDP
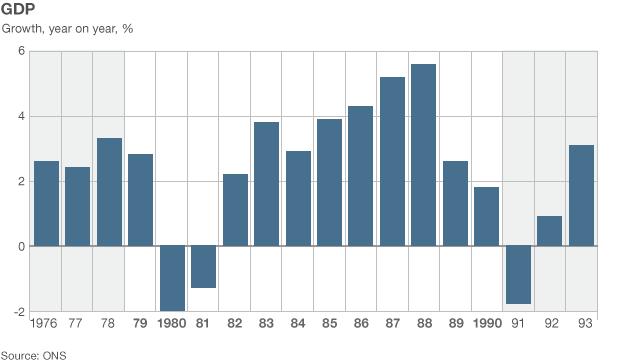
Inflation was running at more than 25% at times in the 1970s, so a key tenet of the incoming Conservative government was to bring it down.
However tough budgetary measures meant that growth suffered in Mrs Thatcher's first term, with a deep recession in the early 1980s followed later in the decade by a boom.
Interest rates
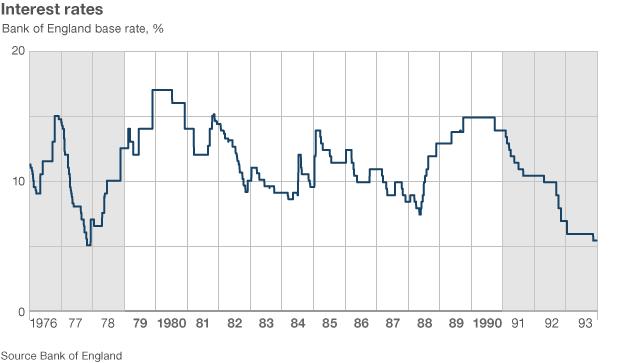
The base rate was then set by the government rather than the Bank of England itself, meaning the government could use it as a tool in their economic policies.
In November 1979, the government raised interest rates to 17% in order to tackle inflation This harmed manufacturing industry and exports, but did eventually have the desired effect on inflation.
However the base rate was pushed up again towards the end of Mrs Thatcher's last term in office to curb inflation, which was stoked by rising house prices.
Council house sales
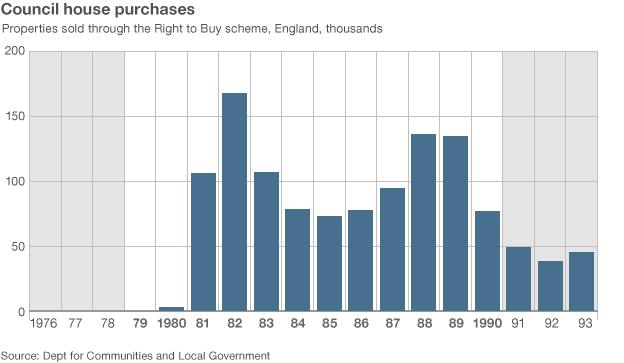
For Margaret Thatcher, home-ownership was a right, and one which which she believed should be extended to council house tenants.
One of the first acts of her government was to launch a Right to Buy policy which came into force in 1980.
It allowed local authority tenants to purchase their council house at a discount of up to 70%. More than a million took up the offer under her premiership and a version of the scheme is still running today.
House prices
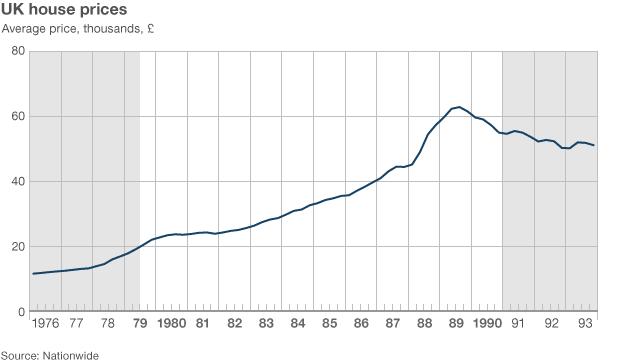
As home ownership grew, house prices also rose, climbing 32% in the year to March 1989. This growth would be followed by a slump during the recession of the early 1990s, under John Major's government.
- Published8 April 2013
- Published9 April 2013
- Published9 April 2013
- Published8 April 2013