Election 2015: How the opinion polls got it wrong
- Published
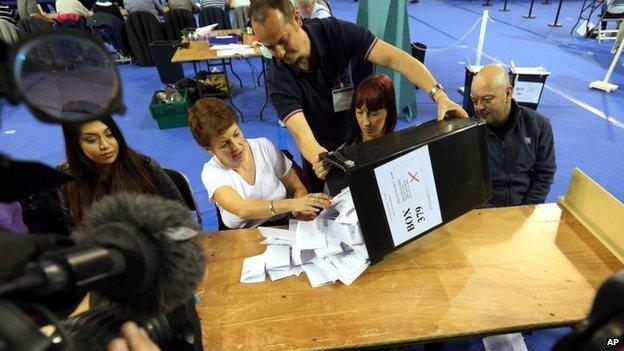
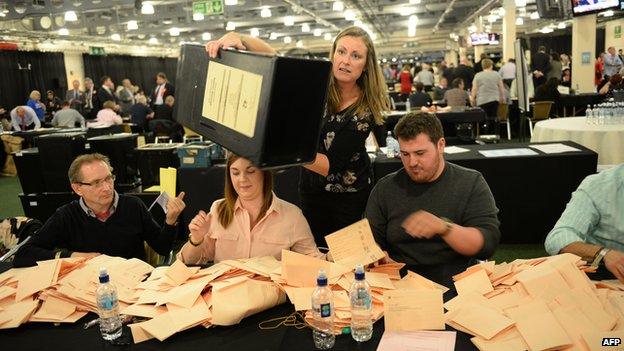
Following the outcome of the 2015 general election, a mixture of anger and contempt was showered on the pollsters who had spent six weeks suggesting a different result.
I understand those feelings, but I do not share them.
Prior to working in the media I was employed in three polling companies and therefore have some sympathy with their plight.
The purpose of this piece is not to beat them up even more, but to set out what evidence I have gathered and offer some personal views about some of the explanations that have surfaced in the immediate aftermath of the election.
A serious investigation is about to begin, which will have the advantage of viewing the mass of data generated by 92 campaign polls.
Like you, I await the findings with anticipation.
Under-achievement
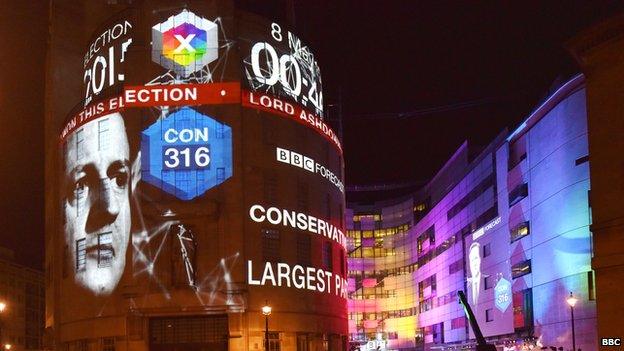
On the day we awoke to a new majority Conservative government, the British Polling Council, supported by the Market Research Society, issued a statement.
It said: "The final opinion polls before the election were clearly not as accurate as we would like."
It announced it was "setting up an independent inquiry to look into the possible causes" and "to make recommendations for future polling".
It will be chaired by Prof Patrick Sturgis, professor of research methodology and director of the ESRC National Centre for Research Methods.
A variety of explanations have been offered to explain the collective failure of the polling industry to provide accurate estimates of the final vote shares of the Conservative and Labour parties.
It is worth reminding ourselves of the scale of under-achievement that we experienced over the six-week campaign.
I monitored 92 polls over that period and the table below divides them into various percentage leads, ranging from 17 dead heats to three polls where the gap was 6% between Conservative and Labour.
None of the 92 polls accurately predicted the 7% lead the Conservatives would actually achieve.
Excluding the dead heats, we are left with 75 polls where one party was ahead of the other and, among these, 42 (56%) suggested Labour leads.
Among the full tally of 92 campaign polls, 81 registered leads for one party or another of between 0% and 3%.
Did something similar happen in 1992?
The failure of the eve-of-election polls to reflect the actual result of the 1992 general election "was the most spectacular in the history of British election surveys", according to the July 1994 Market Research Society's investigative report.
During the 1992 election some 50 campaign polls had been published, 38 of which suggested small Labour leads - but the outcome was a seven-point Tory win.
The report that followed - Opinion Polls and the 1992 General Election - identified three main factors for the failings of the polls.
The first was late swing. Some voters changed their minds after the end of interviewing.
Secondly, samples may not have been sufficiently accurate in representing the electorate.
Finally, Conservatives were less likely to reveal their loyalties than Labour voters.
These may strike many of you as rather familiar 23 years later, but we should remember that the pollsters introduced a series of post-1992 reforms that were meant to redress these problems.
I will try to pick these up as we take a brief look at some of the explanations offered for the poll performance in 2015.
Was it down to a late swing?
Put crudely, the proposition is that voters said one thing to the pollsters, but in the polling booth a significant number of them changed their minds and voted Conservative.
Survation had made much of the late telephone poll it conducted that showed: Conservatives 37%, Labour 31%, Lib Dems 10%, UKIP 11% and Greens 5%.
The actual result was Conservatives 38% and Labour 32%.
It claimed that this more accurate result was due to it being "conducted over the afternoon and evening of Wednesday 6 May, as close as possible to the election to capture any late swing to any party".
Much has been made of a potential late swing that may have transformed the outcome of the election
However, both MORI and ICM conducted their final polls on Wednesday evening and respectively came up with leads of one point for the Conservatives and one point for Labour.
The Ashcroft "on the day" poll, conducted among more than 12,000 respondents who had voted, resulted in: Conservatives 34%, Labour 31%, Lib Dems 9%, UKIP 14% and Green 5%.
That was four points out on the Conservatives' share and one point out on Labour's.
The YouGov "on the day" poll of more than 6,000 respondents who had voted suggested a dead heat, with: Conservatives 34%, Labour 34%, Lib Dems 10%, UKIP 12% and Green 4%.
Finally, the last Populus poll was sampled from 5-7 May, so included some respondents interviewed on polling day itself.
It found: Conservatives 33%, Labour 34%, Lib Dems 9%, UKIP 13% and Green 5%.
People will draw their own conclusions from all this but it suggests to me that, on the evidence of the polls, whether conducted into Wednesday evening or among actual voters on election day itself, there appears to be little to sustain the proposition of a late swing.
If there was indeed such a late swing then the polling industry is left with the considerable headache of having comprehensively failed to pick it up either before or during polling day itself.
Were 'shy Tories' a factor?
One of the preoccupations of the 1992 inquiry into the polls was whether significant numbers of Conservative voters, reluctant to admit their allegiance, simply answered "don't know" or just avoided participating in polls.
At the end of their deliberations, the authors concluded: "it is possible to weight or reallocate 'don't knows' on the basis of their reported past vote".
This is what some pollsters do and it should dampen, though not eliminate, any "shy Tory" effect.
But it did not appear to have done so this time.
In any event, there is also the small issue of why there should only be shy Tories in 2015.
Surely the message of the last two years has been that all three main Westminster parties were very unpopular?
Why else did 25% of voters on 7 May not support the Conservatives, Labour or Lib Dems, compared with 12% in 2010?
One poll in the campaign asked voters whether they would be confident about admitting their party affiliation in company.
Those most "shy" were UKIP supporters, yet the polls were pretty accurate when it came to UKIP's actual share of the vote.
I do not mean to dismiss the "shy Tory" argument out of hand, but I find it far less plausible in 2015 than in 1992 and some subsequent general elections.
Did 'lazy Labour' voters cause the upset?
These are the new kids on the block in 2015.
There is a theory that the unexpected outcome of the election was due to lazy Labour non-voters - people who declared a Labour voting intention to pollsters during the campaign but did not turn up to express it at polling stations.
Pollsters have tried to address the issue of differential turnout between party supporters for some time.
Almost invariably, respondents will be asked to choose on a scale from one to 10 how certain they are to vote.
Having looked at these polls over very many years, it is commonly the case that Conservatives are somewhat more likely to vote than Labour.
Eight of the polling companies that featured in the 2015 election campaign use this 1-10 scale and in the table below I set out the percentage of Conservative and Labour voters who answered 10 out of 10 in their final campaign poll.
Opinium and TNS use a different, non-numerical scale and, for these, 90% of Conservatives said they would definitely vote in the Opinium poll, compared with 87% of Labour.
The comparable figures on the same wording in the TNS poll were 89% and 80% respectively.
This presents us with something of a mixed bag: ComRes, MORI, Opinium and YouGov suggest very little, if any, difference in determination to vote between both sets of party supporters just prior to polling day.
Among the other companies, Conservatives seemed marginally more motivated than Labour.
So, firstly, the issue of Labour supporters having a lower propensity to vote is not new: the companies have been aware of it for a long time.
Secondly, a number of polling companies adjust their voting intention figures precisely to take this into account.
In this election, "Lazy Labour" would have had to be a new and very late addition to the tribe to account for the impact suggested.
Did the pollsters survey enough people?
Most opinion polls in non-election years question a standard of just over 1,000 respondents, but would this provide a robust enough sample for the eve-of-election polls, by which the polling companies are traditionally judged?
Clearly a number of them thought not, as their final poll samples showed.
In addition, the Ashcroft "on the day" poll comprised 12,253 respondents who had voted. YouGov's similar effort involved 6,000 respondents.
Sample size does not seem to offer any obvious explanation. Although that is, of course, only part of the story.
A poll can consist of 20,000 respondents but, if they are not representative of the general population, they are no more use than a sample of 200.
So what have we learned?
What to conclude? A variety of explanations have emerged from the polling industry to try to answer the challenging question of why so many polls were so wrong in the 2015 campaign.
The scale of the problem cannot be understated. Whilst the Conservatives won convincingly, 18% of the campaign polls had suggested a dead heat and a further 46% had suggested Labour leads.
Of the 36% of polls that registered Conservative leads, three out of four showed leads that were less than half the actual outcome.
Two polls - from Ashcroft and ICM - gave the Conservatives a 6% lead but these were published about two weeks before polling day.
Those two companies published final eve of poll figures suggesting a dead heat (Ashcroft) and a one point Labour lead (ICM).
I have rehearsed some of the possible explanations and will not burden you by repeating them. It could be the case that the answer lies in combinations of all of them - no single one of them a decisive influence but all of them were contributory factors.
I think the evidence does not provide any easy solutions and Prof Sturgis's enquiry will have its work cut out to provide answers that will satisfy a very sceptical audience.
But lest we forget, the British polling industry has provided very accurate election vote share forecasts in the past, recently as well as historically.
I would take a lot of convincing that everything has suddenly and irretrievably gone pear-shaped.
That the pollsters face challenges is undeniable, not least among them the problem of finding truly representative samples of the population.
But any thoughts of their demise as important players in helping us understand public opinion seem, to me at least, rather premature.
- Published5 May 2015
- Published28 March 2015
- Published8 May 2015
