EU Referendum: Were young people less likely to vote?
- Published

Young people have been seen as more pro-EU than older voters
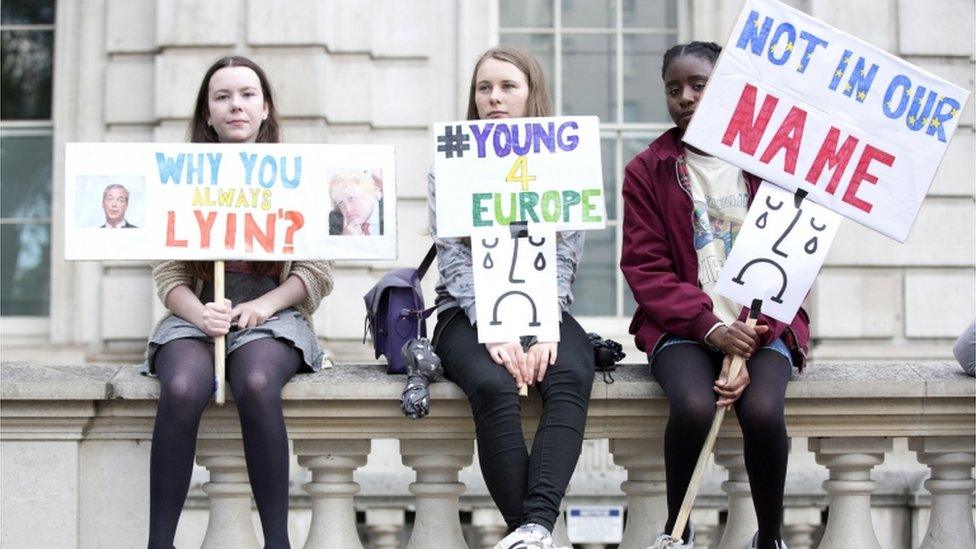
One of the key voting patterns in the EU referendum was that younger people were keener than older people on remaining in the EU.
At the same time, however, one of the persistent features of voting in any contest is that younger people are less likely to go to the polls.
Consequently, one of the key challenges facing the Remain campaign was whether it could persuade young people to turn out to vote.
There have been divergent claims about how successful they were.
Much attention was attracted by a tweet from Sky Data, external that seemingly implied that only 36% of 18-24 year olds had turned out to vote.
In practice, it seems the figure referred to people's likelihood of voting rather than whether they had actually voted.
In contrast, Prof Michael Bruter and Dr. Sara Harrison of the London School of Economics have suggested that as many as 70% of 18-24 year olds might have voted, only slightly below the official figure of 72% for all voters.
'Not interested'
In truth, reliable information on the level of turnout among particular groups of voters is currently not available.
True, five polls that asked people whether they voted on 23 June have been conducted.
However, opinion polls struggle to secure the participation of people who do not vote. Unsurprisingly, the reaction of many non-voters to a request to answer a poll about politics is to say: "Thanks, but I am not interested."
In four of the five polls, on average only 11% of respondents said that they had not voted, well below the official figure of 28% (though even that figure is not 100% reliable, as some people were not registered to vote, while others may have died or be registered at more than one address).

Turnout was generally high on 23 June
In the fifth case the polling company in question, BMG Research, weighted their data to match the official figure.
In practice, much like the other polls, only 12% of their original sample had not made it to the polling station either.
If the polls are underestimating the overall level of abstention among voters as a whole, they will also be at risk of underestimating the differences in the level of abstention between those in different age groups.
That certainly seemed to be one of the lessons of the difficulty that the polls had in anticipating accurately the outcome of last year's general election.
However, one point does seem to be clear about turnout in the referendum. Younger voters were, once again, less likely than older voters to cast a vote.
All of the post-referendum polls find the same pattern. The older a respondent, the less likely they were to say that they did not vote.
Election v referendum
The four polls that did not weight their data to the actual level of turnout report on average that 16% of 18-34 year olds abstained, well above the 11% figure for respondents as a whole.
Meanwhile, after weighting their data to the official result, BMG estimate that those aged 18-34 were twice as likely to abstain (40%) as those aged over 65 (20%).
A more difficult question to answer is whether young voters were more likely or less likely to have abstained in the referendum than they were in last year's general election?
To address that issue we need to compare the reported levels of abstention in polls conducted since the referendum with those in polls undertaken in the same way by the same company immediately after the general election.
Whatever the limitations of a particular poll in estimating turnout, those limitations are likely to be similar on the two occasions.
That comparison is possible for just one poll. Survation's post-referendum poll, conducted online for the Mail on Sunday, can be compared with a poll that the company undertook (also online) immediately after last year's general election.
Reported Abstention in 2015 General Election and 2016 EU Referendum
Sources: Survation 8-9/5/15 & 24-25/6/16
As the table shows, the differences in the pattern of abstention this year look very similar to those of last year; statistically, they are certainly too small for us to rule out the proposition that the difference between younger and older voters in their level of turnout was much the same in the referendum as in last year's general election.
When might we get more reliable information on who voted?
The best (though by no means perfect) evidence comes from academic surveys that are conducted face-to-face over a long-period of time with respondents who have been chosen for interview at random.
Months to wait
Such surveys are more successful in making contact with those who have little interest in politics, especially if the survey is not all about politics.
One such survey is the annual British Social Attitudes (BSA) survey conducted by NatCen Social Research.
When it asked its respondents after last year's general election whether or not they voted, the proportion saying they did so (70%) was not far adrift from the official turnout figure (66%).
However, it will be several months before the interviewing for this year's BSA is completed and the results made available.
In the meantime, the best advice is to examine critically any claims that young people were particularly likely or unlikely to have voted this time around.