Why were the polls wrong again in 2016?
- Published
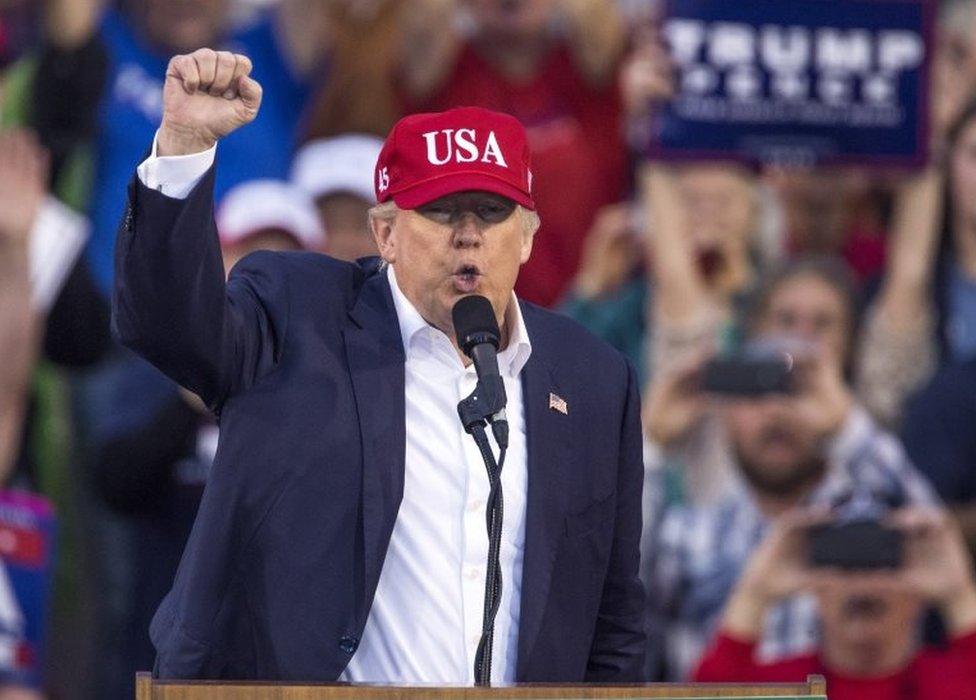
Victories for Donald Trump and Brexit have confounded the pollsters again, after most got the 2015 general election wrong. But were they to blame?
In the aftermath of the 2015 general election opinion poll debacle, I spoke to an old friend in the business. He said that normally, after such a bad experience, you have to wait five years until the next general election to discover whether the changes you have put in place really work.
However, the promised EU referendum meant he and his fellow pollsters would be tested much sooner.
It is important to remember the scale of the 2015 polling failure because it set the scene for the events of 2016. In the face of a seven-point Conservative lead among voters on 7 May 2015, 18% of campaign polls had suggested a dead heat and a further had 46% suggested Labour leads.
Of the 36% of polls that registered Conservative leads during the six-week election campaign, three-quarters published leads that were less than half the actual outcome of seven points.
Within 24 hours of the close of poll, the British Polling Council supported by the Market Research Society issued a classic example of English under-statement, declaring "the final opinion polls before the election were clearly not as accurate as we would like" and announcing that they were "setting up an independent inquiry to look into the possible causes of this apparent bias, and to make recommendations for future polling".
The report was published in March, external and focused on one main cause of the failure to correctly call the outcome of the election: "Our conclusion is that the primary cause of the polling miss in 2015 was unrepresentative samples.
"The methods the pollsters used to collect samples of voters systematically over-represented Labour supporters and under-represented Conservative supporters. The statistical adjustment procedures applied to the raw data did not mitigate this basic problem to any notable degree. The other putative causes can have made, at most, only a small contribution to the total error."
Polling companies did not wait for the publication of the inquiry before making adjustments to their methodologies but the June referendum on UK membership of the EU presented additional challenges.
At one level the EU Referendum should have been much easier for pollsters. Whereas in general elections we require them to achieve high levels of accuracy for each of at least four political parties, in a referendum there are only two choices - Yes or No, Leave or Remain.
However, there was one important missing ingredient in the referendum as far as pollsters were concerned, namely how people had voted previously. Westminster voting intention polls invariably ask respondents not only how they intend to vote in the next general election but also how they voted in the previous one.
This past-voting data allows them to make important adjustments to their samples with the aim of strengthening their overall accuracy. But there was no such past-voting data support for the pollsters in 2016, as there had only been one previous referendum and that one held in 1975.
Mike Smithson, of Political Betting, gets pretty fierce with those who claim that polls in the 2016 referendum delivered a similar car crash to the 2015 general election. He calculates that of the 34 referendum campaign polls, 17 gave leads for Leave, 14 had Remain ahead and three suggested a dead heat.
That is a reasonable point, but the traditional test of how they performed is the record of final campaign polls compared with the outcome. On this specific measure the polling industry still appears to be languishing in Purgatory.
In June, the British Polling Council reported its analysis of the final EU referendum polls, external published by seven member companies. No company correctly forecast the actual result, although "in three cases the result was within the poll's margin of error of plus or minus three points. In one case Leave was correctly estimated to be ahead. In the four remaining cases, however, support for Remain was clearly overestimated".
"This is obviously a disappointing result for the pollsters, and for the BPC, especially because every single poll, even those within sampling error, overstated the Remain vote share."
In addition, there were three on-the-day polls (combining actual voters and others reporting their voting intention on polling day) published by BMG, YouGov and Ipsos MORI and these predicted Remain leads of 53%, 52% and 54% respectively.
We have witnessed polls that consistently overstated Labour support and many that overstated support for Remain. All too often in the past polling errors at elections have been forgotten because the polls concerned still predicted the correct outcome.
The mortal sin is to predict the wrong outcome and the heat is on the polling industry today because that is precisely what it has done in the two biggest political events of 2015 and 2016.
But what about polling in the US presidential election?
Here we need to begin by reflecting on the US electoral system. Presidents are elected as a result of winning a majority of electoral college votes, not the national popular vote.
To assess the accuracy of polling in the 2016 presidential election, we need to look at national polls for their measure of the popular vote received by the candidates and then polling in individual states to discover how well they predicted the outcome of the crucial electoral college votes.
The highly respected Cook Political Report observed: "On average, polling in 2016 was closer to the results of the election than it was in 2012. President Obama's final popular vote margin was 3.9 points, but the RealClearPolitics running average before election day was 0.7 points, a difference of 3.2 points. The difference in 2016 was just 1.1 points."
Specifically, the RealClearPolitics running average of 10 final polls (sampled between 1 and 7 November, 2016) gave Clinton 46.8% and Trump 43.6%, compared with the final outcome of Clinton 48.2% and Trump 46.1%: a respectable performance, with the final average within sampling error and predicting the correct winner of the popular vote.
The US polling problem lay with the state-wide polls. If we look at the 13 swing states (those that either changed allegiance compared with 2012 or were decided by 5% or less of the popular vote) we find that Michigan, Pennsylvania and Wisconsin were predicted for Clinton when they voted Trump; and that in Iowa and Ohio the predicted Trump wins significantly understated his final margins of victory.
The EU referendum campaign did not restore the badly dented reputation of pollsters in the UK following their grim performance in 2015. And in the US, performing well in predicting the popular vote but getting important state polls wrong leaves you with egg on your face, and President Trump.
I do not envy the pollsters as they navigate their way through a society that is increasingly fragmented and where increasing numbers of people are refusing to stay in their box.
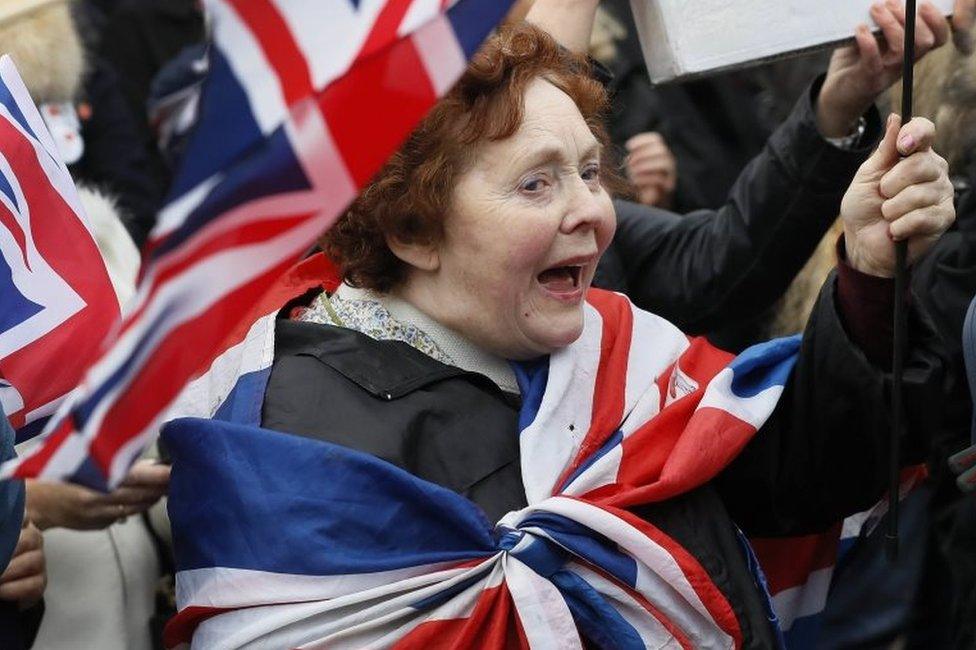
The EU referendum saw the largest turnout in England since the 1992 election; 2.8 million more people voted in the 2016 referendum than in the 2015 general election.
In 2015 the main polling problem was defined as unrepresentative samples. At the close of 2016 it still is.
- Published8 November 2016
- Published22 June 2016
