How political polling tells the story of 2017
- Published
Theresa May began 2017 with good ratings and a solid majority, but gambled both on a snap general election that backfired. How did opinion polls reflect this rollercoaster year in British politics?


Reviewing polls in 2017 it's helpful to divide the year into three sections: the period before Theresa May called the surprise general election, the campaign period itself, and the months since then.
The longer first and third parts of the year have been times of only gradual movement.
The election campaign saw rapid and very large shifts.
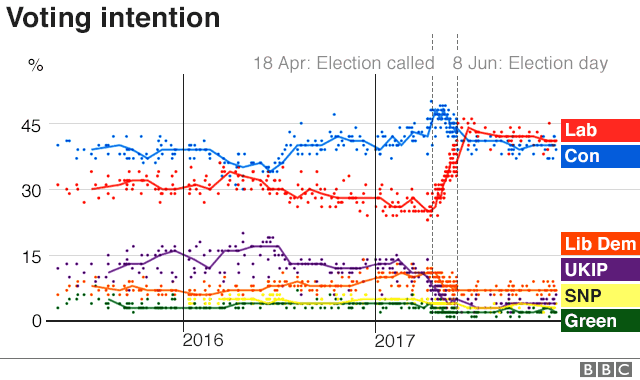
In the period up to 18 April, when Mrs May announced she wanted an early election, the Conservatives saw their poll rating nudge upwards whilst Labour's gradually slid downwards.
The gap between the parties may not have been the primary reason for her decision but she would surely have held fire if the polls had been closer.
In the immediate aftermath of the announcement the Conservatives went up even further, hitting 50% in one poll - the highest for any party since 2008.
But then Labour's ratings started to rise.
At first the shift was small and differences between polling companies made it hard to be certain what was going on.
During this phase, Labour's advance seemed to come mostly at the expense of UKIP.
As the campaign went on though, and especially after the publication of the manifestos, Labour's position continued to strengthen whilst the Conservatives fell back.
As we now know, most of the final campaign polls were still badly underestimating Labour's strength.
But they did pick up the direction of travel - and the shift was bigger than anything we'd seen before.
Allow X content?
This article contains content provided by X. We ask for your permission before anything is loaded, as they may be using cookies and other technologies. You may want to read X’s cookie policy, external and privacy policy, external before accepting. To view this content choose ‘accept and continue’.
Since the election, most polls have had Labour in the lead.
But there's been a slow decline from their immediate post-election highs and the most recent polls have the two main parties essentially neck and neck.
In Scotland and Wales there are fewer polls to go on but, based on the available evidence, the patterns in both are different from Great Britain as a whole.
Labour has seen improvement everywhere - again, with most of the rise occurring during the election campaign.
But in Scotland this has largely come at the expense of the SNP, and in Wales from UKIP.
This could be evidence of former Labour voters who had switched to those parties returning to the fold.


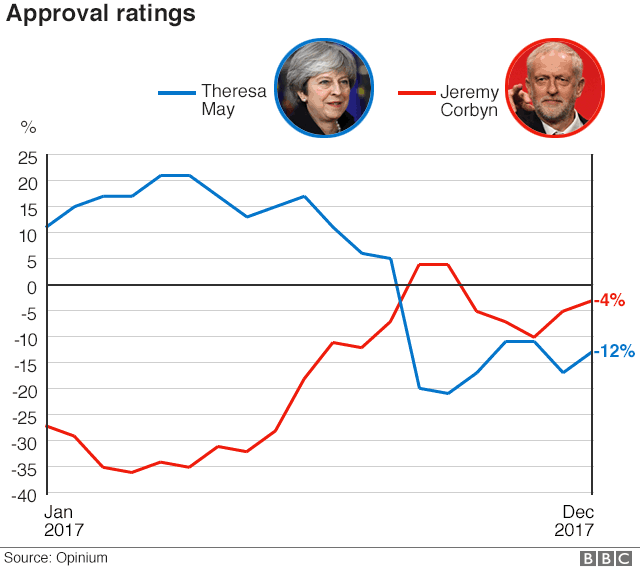
The approval ratings for Theresa May and Jeremy Corbyn over the course of the year follow a similar pattern to voting intention, but the movements are more exaggerated.
The graph shows the net approval scores in Opinium's, external polling series - in other words it's the percentage of people who say they approve of each leader minus the percentage who say they disapprove.
Mrs May started the year with a positive score which went up in the months before the election was called. It then wobbled a bit in the first few weeks of the campaign before going into a precipitous decline.
Jeremy Corbyn's rating followed the reverse of this pattern.
The two lines cross at about the time of the election although Theresa May's initial response to the Grenfell Tower fire was almost certainly an important factor in people's assessments in late June and July.
The second half of the year has seen the gap narrow again.
Mrs May's ratings have improved whilst Mr Corbyn's have drifted. Still, the overall change since the beginning of 2017 is very large.


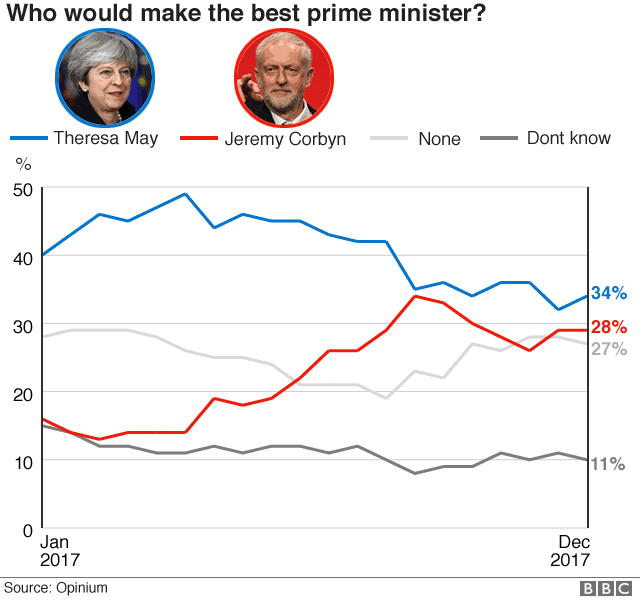
Despite Jeremy Corbyn having higher approval ratings than Theresa May, he does not fare so well when people are asked who they think would make the best prime minister.
The graph follows a similar shape but in Opinium's series (shown above) the Labour leader has never been in front.
Poll company BMG, external have generally been a little more favourable to Corbyn but others have almost uniformly had May ahead.
The discrepancy between the two graphs is maybe not as strange as it seems. Opposition leaders tend to perform less well on 'best prime minister' questions.
At the beginning of 2008, for example, David Cameron - leader of the opposition at the time - had better approval ratings than Prime Minister Gordon Brown.
But it was Brown who was seen as the most capable PM according to Ipsos MORI's, external polls from the time.
There seems to be a 'better the devil you know' factor at play when people are asked to say which leader should be in charge.
There's been a wealth of polling on Brexit - something which seems certain to continue into the foreseeable future.
Professor John Curtice from NatCen Social Research, external has produced a series of reports for What UK Thinks , externalon people's attitudes towards Brexit and how they've developed over time.
Their most recent report contains a lot of interesting data, external.
One finding is that people have become more pessimistic over the course of the year about the likely outcome of Brexit negotiations.
They've also become more negative in their assessment of how the government is handling the talks.
It should be noted, however, that the latest figures are from October - before the December breakthrough in negotiations.
It's quite possible that this will lead to an increase in optimism and more positive assessments of the government's performance.
Either way, there's not really any clear evidence of any significant shift in voters' basic view either in favour or against Brexit.
YouGov , externalhave regularly been polling throughout the year on whether Britain was right or wrong to vote to leave the EU. As the graph shows, there has been very little movement.
It's true that at the start of the year 'Right' was generally a few points ahead whereas at the end of the year it's been 'Wrong' slightly ahead. But any genuine change is very small.
The only safe conclusion from this evidence is that the country remains roughly equally split on this issue.
Other pollsters have mostly had similar figures.
One poll published just a week ago by BMG, using the actual referendum question from 2016, did suggest a bigger shift.
That put Remain on 51% and Leave on 41%, with 7% undecided and 1% preferring not to say.
This is just a single poll, though, as BMG point out themselves. And it was mostly conducted when talks in Brussels seemed to be stuck over the issue of the Irish border. It does not overturn the more consistent picture.
It's tempting to say, as somebody once put it, that on support for Brexit nothing has changed.
* Follow Peter Barnes on Twitter , external