How can you tell who's won the local elections?
- Published

If you've been reading about the local elections, which take place in England on 3 May, you might have seen people talking about 'benchmarks' or suggesting numbers of seats that would count as a good result for each of the parties.
But what do they mean? And should you pay any attention?
The four-year cycle
Interpreting local election results in England is not easy. For one thing, there's more than one kind of council and they follow different electoral cycles.
In some places voters elect all the councillors once every four years. In other places the councillors are elected a third at a time or a half at a time.
Also, the list of places that have elections varies from year to year.
In 2018 the elections are weighted towards places where Labour is strong. They currently hold more than half the seats that are up for election and it would take a big shift for them not to end up as the party that wins the most seats on 3 May.
Last year it was the opposite. The local elections were concentrated in places where Conservatives are dominant.
This geographical variation means it's not particularly useful just to look at the total number of seats each party wins. That's why election analysts tend to focus on change - the number of seats each party gains or loses.
How the BBC is reporting the results
Baselines and boundary changes
In general, councillors are elected for four year terms. That means that most of the seats which are being contested in 2018 were last fought in 2014.
We talk about 2014 being the principal 'baseline' year. Gains and losses of seats will mostly be gains and losses compared to 2014.
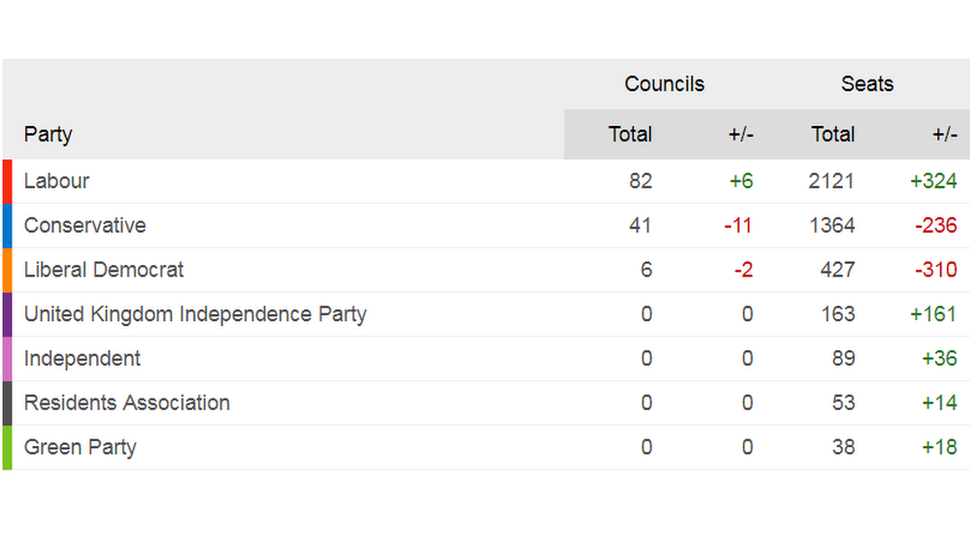
So any assessment of the results this time will have to take into account what happened then. This is the top of the 2014 scoreboard.

Labour, UKIP and the Greens made gains. The Conservatives and Lib Dems lost out.
There are exceptions to the four year rule.
Just like the Westminster parliament, local councils are occasionally subject to boundary changes.
When that happens, the normal procedure is that all of the new seats are contested at once, even if that's not the standard pattern. Then some councillors might only get to serve a short term before they have to face the voters again.
So there are some council seats being elected this year which were actually last contested in 2015 and 2016 when boundary changes took place in their respective councils.
In other cases, councils switch to a different electoral cycle. There were 11 councils with elections in 2014 that don't have them at all this time.
Finally, there are councils being fought for the first time on new boundaries at this election.
In those cases, just like with parliamentary elections, the BBC and other broadcasters use 'notional' baselines - estimates of how many seats each party would have won if the new boundaries had been in place at previous elections.
Putting this all together gives the following figures for the number of seats each party is defending.
Benchmarks
One way of forecasting local election results is to look at recent opinion polls and compare them against polls from four years ago. If a party has gone up in the polls since then it might be expected to gain seats. If it's gone down in the polls it might be expected to lose seats.
By looking into the voting numbers in more detail you can come up with benchmark figures for how many seats each party could be expected to gain or lose if they perform in line with recent polls.
The crucial point to realise is that this kind of benchmark does not on its own give you a clear idea of what would count as a 'good' result.
If a party is flying high in the polls in comparison with four years ago then a polling benchmark will forecast a large number of gains. If it makes slightly fewer gains you might say that the party has not done quite as well as the polls had suggested. You might also conclude that the party will be a bit disappointed. You should not necessarily say that it has performed badly.
It's also possible to produce a similar type of benchmark by looking at the results of local council by-elections instead of opinion polls. These by-elections take place throughout the year when councillors resign or die in office.
Using this method, professors Colin Rallings and Michael Thrasher estimate that Labour is on course to win about 200 extra seats, mostly in London, whilst the Conservatives could expect a net loss of 75 seats. The Liberal Democrats would make modest gains whilst UKIP would struggle to hold on to the seats they are defending.
Again, though, it's important to understand that the benchmark forecasts are an extrapolation from recent by-election results, not an assessment of what would count as a 'good' result.
So how do you judge who's done well?
Government and opposition
One regular pattern in local council results is that the parties who are in government in Westminster tend to lose seats whereas opposition parties tend to gain them, except in years which also have general elections. Looking back again at 2014, when the Conservatives and Liberal Democrats were in coalition, that's exactly what happened.
For the main opposition party, failing to achieve gains in non-general election years is a sign of a poor performance.
Labour did suffer losses in 2016 - by any measure a bad result - but they lost fewer seats than people had predicted.
They also lost seats in 2017 but, of course, that turned out to be a general election year.
Historic highs and lows
Another way of gauging results is to look back at the total number of councillors each party has had over time. Gains are less impressive if a party is starting off from an historic low point.
In London, strong gains for Labour could see them set a new record for the number of seats held. The figure to beat is the 1,221 they won in 1971.
Substantial losses for the Conservatives could see them fall beneath their 1994 low point of 519 seats - not a record they want to set.
Nationally, the picture is different though. The Conservatives have more than 9,200 seats across Britain compared to Labour's 6,400 and will still be the biggest party in local government whatever happens.
The Liberal Democrats are also a very long way off the totals they used to achieve before going into government in 2010. Any gains should be seen in this context.
Council control
As well as looking at the number of council seats each party wins you can also look at how many councils they control and which ones.
Again, there's been speculation that in London Labour might be close to scoring historic victories in councils that have been Conservative for decades. Capturing either Wandsworth or Westminster council - both considered Tory flagship councils - would certainly be a feather in their cap.
You can read more about some of the interesting council contests in this guide to the local elections.
Projected National Share
Finally, the BBC will be conducting its regular exercise of trying to extrapolate a national picture from the results of the elections being held this year.

Professor Sir John Curtice and his team look at the detailed results in more than 900 council wards to produce what's called the Projected National Share or PNS.
It's an attempt to estimate what the national result would have been if council elections had been held across the whole country. It allows us to compare the performance of the main parties with previous years.
2017 saw the Conservatives on 38%, Labour on 27% and the Liberal Democrats on 18% in the PNS. In other words, the Conservatives clearly won.
But at the general election just a month later their margin of victory was cut to just 2.5%