General election: Labour's £6,000 bill claim fact-checked
- Published

Labour's shadow chancellor John McDonnell says the Conservatives' failure to curb bills has cost the average household an extra £5,949 a year since 2010. But how has Labour arrived at this figure and do their sums add up?
Labour has provided a breakdown of annual bills and costs, which it says have risen since 2010:
£68 more on dual-fuel energy bills
£75 more on water bills
£204 more on broadband bills
£1,740 more on season rail tickets
£1,916 more on average for childcare per child
£22 more on yearly prescription charges
£1,924 more on rent
That adds up to £5,949.
But there are several factors to be considered.
First, the overall figure assumes that every household consumes the same range of things. For example, Labour's average household has two people buying annual rail season tickets - but many people don't regularly travel by train. The Department for Transport estimates that in England in 2018, just 11% of trips were by rail or underground. Part of Labour's average cost is for childcare for a two-year-old, but not every household has children.
The second point is that the report takes the difference in cost between 2010 and 2019 (or 2018) and comes up with a total that is applied to every year. "A decade of cuts and the Conservatives' failure to curb rising bills, have cost families almost £6,000, a year since 2010," the report says. But using Labour's figures, that sum really only works for the final year. The difference would be much smaller from 2010 to 2011, for instance.
The final point is that the prices of most goods and services have risen over the past decade - that's inflation. Some of the things in Labour's report have risen less than the measure of wider inflation.
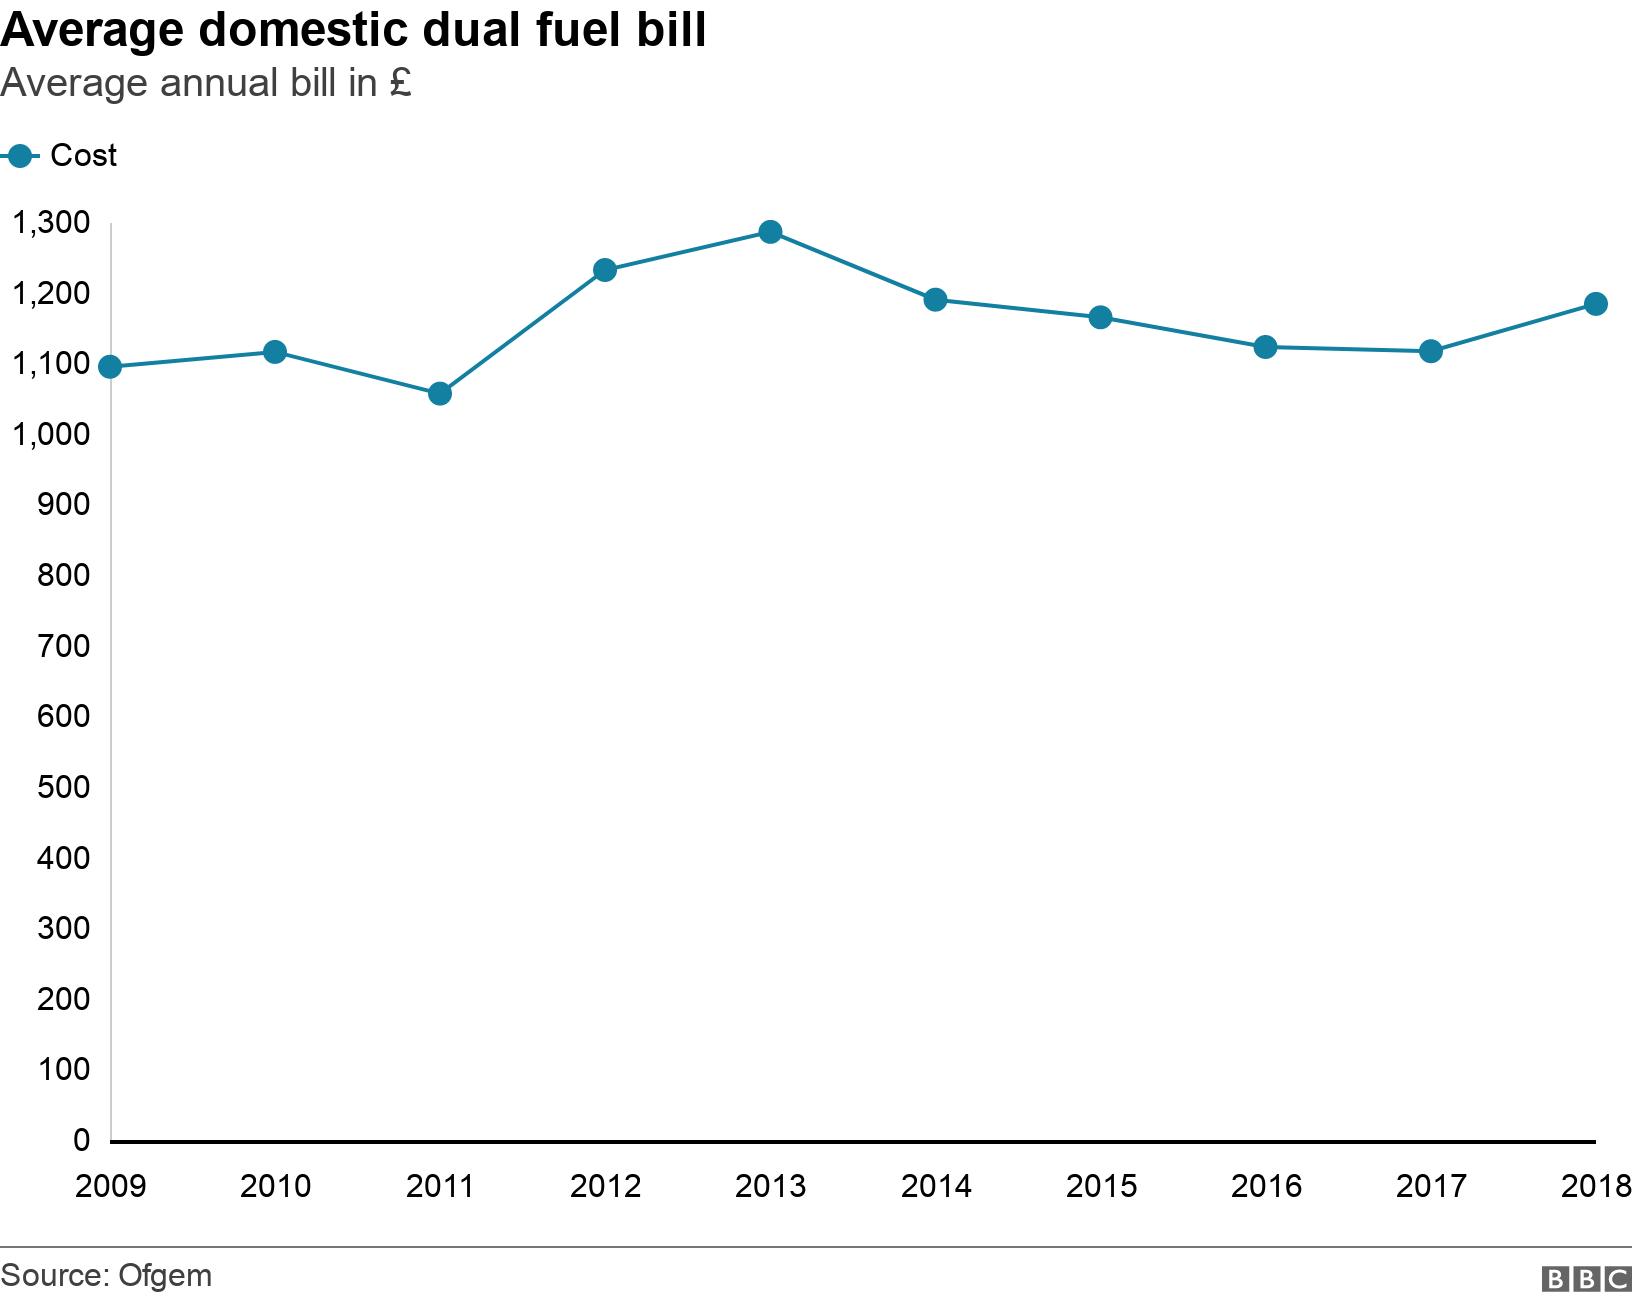
£68 more for on dual-fuel energy bills
Labour has used Ofgem data, external to arrive at this figure.
Its data shows the average dual fuel bill was £1,116 in 2010, rising to £1,184 in 2018. So bills have risen by £68 over the period.
However, that rise is below the wider rate of inflation. According to the Bank of England inflation calculator, external, a bill of £1,116 in 2010 would be worth £1,405 in 2018 prices.
£75 more on water bills
As before, Labour has not just adjusted its figures for inflation.
Water UK - the source Labour has used for its claim - points out that bills are rising more slowly than inflation, external.
"Bills are going down by more than 5% in real terms between 2015 and 2020, and by 2025 there will have been over a decade of falling bills once inflation is taken into account," it says.
£204 more on broadband
Labour says that broadband bills were £13.31 a month on average in 2010, rising to £30.30 a month on average in 2019.
Once again, these figures have not been adjusted for inflation, but they also come from different data sources, so are not strictly comparable.
£1,740 more for season rail tickets
Rail fares do increase every year - in line with a measure of inflation called RPI. Since 2010, season tickets have gone up an average of 35%, according to industry body the Rail Delivery Group.

Labour's report assumes that two people in the same household are purchasing annual season tickets, which may not be representative of all households.
£22 more on yearly prescription charges
Prescription charges only apply to England.
Labour has arrived at the figure of £22 by multiplying the increase in the charge since 2010 (£1.80) by 12, so assuming one person in each household pays for a prescription once a month on average. Many people such as children, pensioners and new mothers do not pay for prescriptions.
Going back to the Bank of England inflation calculator, the rise in prescription charges is actually slightly below the rate of inflation.
The cost of prepayment certificates, which can significantly reduce costs for people who need to pay for a lot of prescriptions, has actually been frozen since 2011.

CONFUSED? Our simple election guide, external
POLICY GUIDE: Who should I vote for?, external
REGISTER: What you need to do to vote

£1,916 more on average for childcare per child
On childcare, Labour says £1,916 more is spent on average for childcare per child, per year.
The number comes from a well-known survey, which indicates that childcare costs have risen above inflation.
But there's a big caveat here - that calculation only covers two-year-olds. For three and four-year-olds, the government has put money into providing free childcare.
£1,924 more on rent
Labour has used the English Housing Survey from the Ministry of Housing Communities and Local Government (MHCLG), which is a national survey of people's housing circumstances in England, to arrive at their figure.
The MHCLG data shows that in 2010 the average weekly rent was £156 and in 2018 it was £193. That's a difference of £37, which equates to £1,924 for a year.
Again, there's no adjustment for inflation.

