Coronavirus in Scotland: Four numbers to watch
- Published

As new confirmed cases of coronavirus continue to rise in most areas of Scotland, how worried should we be? Here are four figures to watch over the coming days and weeks.
1. The percentage of positive cases
Any chart showing the number of daily confirmed Covid-19 cases in Scotland since February has, by now, a very familiar shape.
It rises quickly to a peak in early April, plateaus briefly, before declining at a slower rate and reaching lower levels for several weeks over the summer.
The line begins to curve upwards again at the end of July - at first in a series of steps, but quickly getting steeper.

The graph looks alarming - but there is another factor to take into account to give the figures context.
Testing strategy has changed radically in Scotland since the peak of the outbreak in April. There is now widespread community testing and many more people are being tested.
As a comparison, 1,209 people were tested on 15 April, but six times that number were tested on 16 September.
If more people are tested, more positive cases will likely be found - which is why it's also important to look at the percentage of positive cases.

The percentage of tests coming back positive has decreased since the height of the outbreak - despite more tests being carried out. This is down to prevalence of the virus in the community decreasing.
The World Health Organisation says one measure, external that can indicate whether an epidemic is under control is whether - with a comprehensive testing system - less than 5% of samples return a positive result for Covid-19 over two weeks.
The percentage of positive cases in Scotland went below 5% on 16 May and remained there for 126 days.
However, it began to increase steadily at the beginning of September and finally reached 5.3% on 19 September, rising to 6.3% on Monday.
First Minister Nicola Sturgeon has referred to the WHO 5% measure several times during her Covid-19 briefings over the summer - the question now is how the Scottish government will react if the rate stays above 5% for a sustained period.
2. The rate at which the virus spreads
The R number - also known as the R-value or reproduction number - is a key number that will be crucial to any decisions around lockdown restrictions.
It's a way of rating any disease's ability to spread and refers to the average number of people an individual would be expected to infect.
The higher the number, the more out of control a disease is.
If the reproduction number is higher than one, then the number of cases increases exponentially.
But if the number is lower the disease will eventually stop spreading, as not enough new people are being infected to sustain the outbreak.

The Scottish government has been monitoring the estimated R number in Scotland, external since the start of the outbreak.
Experts believe the number could have risen above one in mid-August. It is currently estimated to be between 1.1 and 1.4.
This compares with an estimate of between 4.3 and 5.8 at the end of February before any lockdown restrictions were put in place.
3. The number in hospital
Although the number of positive cases has been rising steeply, there doesn't appear to be a corresponding increase in the number of Covid-19 patients in hospital.
One reason for this could be that younger age groups, who are much less likely to need hospital care, now account for the majority of new cases.
At its peak, the coronavirus outbreak created a huge load on Scotland's hospitals, with 1,520 Covid patients being treated across the country on 20 April.
Numbers mainly declined until the end of July and then fluctuated between 240 and 275 for several weeks.
However, the Scottish government has now changed the way it counts the total number of coronavirus patients in hospital on a given day, which makes it difficult to draw conclusions from this figure.
Instead, looking at the daily Covid-19 admissions to Scottish hospitals, it is possible to see that numbers are clearly down from the peak, but have shown a slight rise in the last few weeks.

A closer look at the last few months makes it easier to see recent rises.
This next chart shows Covid-19 hospital admissions since 1 July. The seven-day average shows an initial dip, but numbers are starting to pick up again.

4. The number of Covid-19 hotspots
Over the last few weeks there have been new coronavirus cases recorded across most areas of Scotland, but most of the positive tests have been concentrated in a few areas.
The first significant "cluster" of cases was detected at a call centre in Motherwell at the end of July and there have also been significant clusters in Aberdeen and Perth and Kinross.
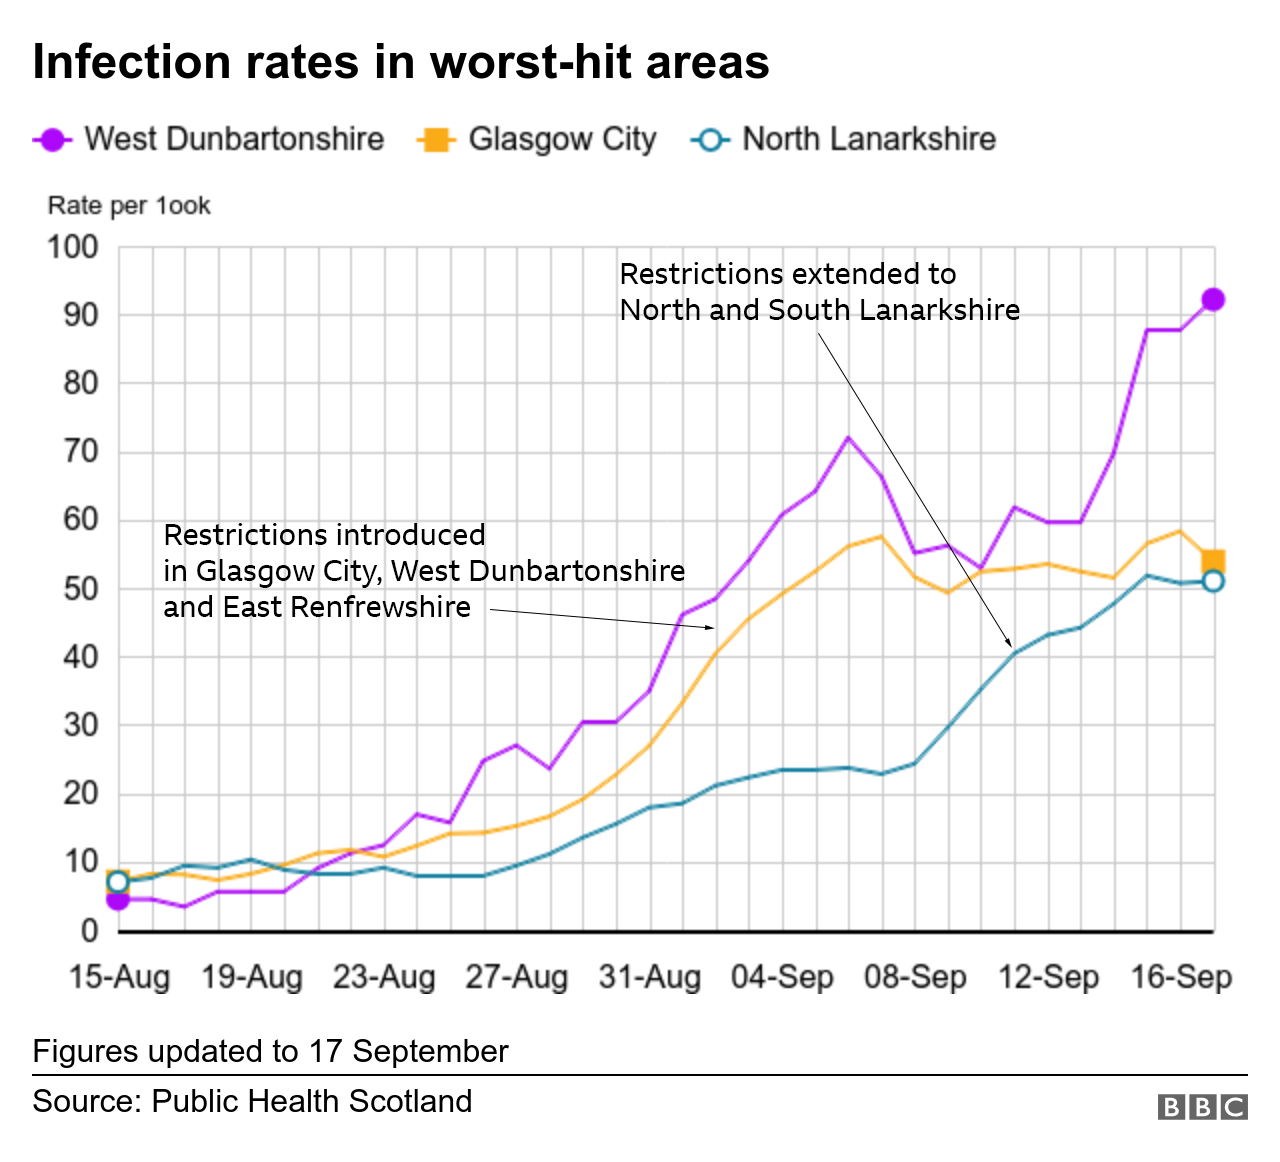
Coronavirus restrictions have been reintroduced in Glasgow, North and South Lanarkshire, East and West Dunbartonshire, Renfrewshire and East Renfrewshire because of a surge in cases there.
One way to compare the different infection rates across the whole of Scotland is with the seven-day case rate per 100,000 people.
This is calculated by adding up all the new positive cases over the last seven days, dividing it by the population of an area and then multiplying by 100,000.

And this is what infection rates in the three worst-hit local authority areas look like since 15 August.

You can also use these figures to make comparisons over time.
At the peak of Scotland's outbreak in April, Dundee reached the highest rate in the country with 144 cases per 100,000 people.
The highest rate so far in this "second wave" of cases is 92.2, recorded in West Dunbartonshire on 17 September.
The Scotland-wide rate on 17 September was 28.1.
The UK tends to consider imposing quarantine restrictions on travellers returning from a country when it has a rate of 20 higher, although other factors come into play.

BACK TO SCHOOL: Can a school insist on a Covid test?
LOCKDOWN EASING: What changes next - and when?
