Five Covid numbers to watch: Has Scotland's 'second wave' peaked?
- Published
- comments

The number of daily deaths from Covid-19 in Scotland's second wave has begun to go down. Hospital admissions are also declining, as are infection rates in the worst affected areas. Has Scotland's second wave peaked, or is there still danger ahead? Here are five numbers to watch.

1. Local infection rates
Across the whole of Scotland, the average number of new cases every day is no longer rising.
The figure appears to have peaked towards the end of October and has mainly been going down since then.
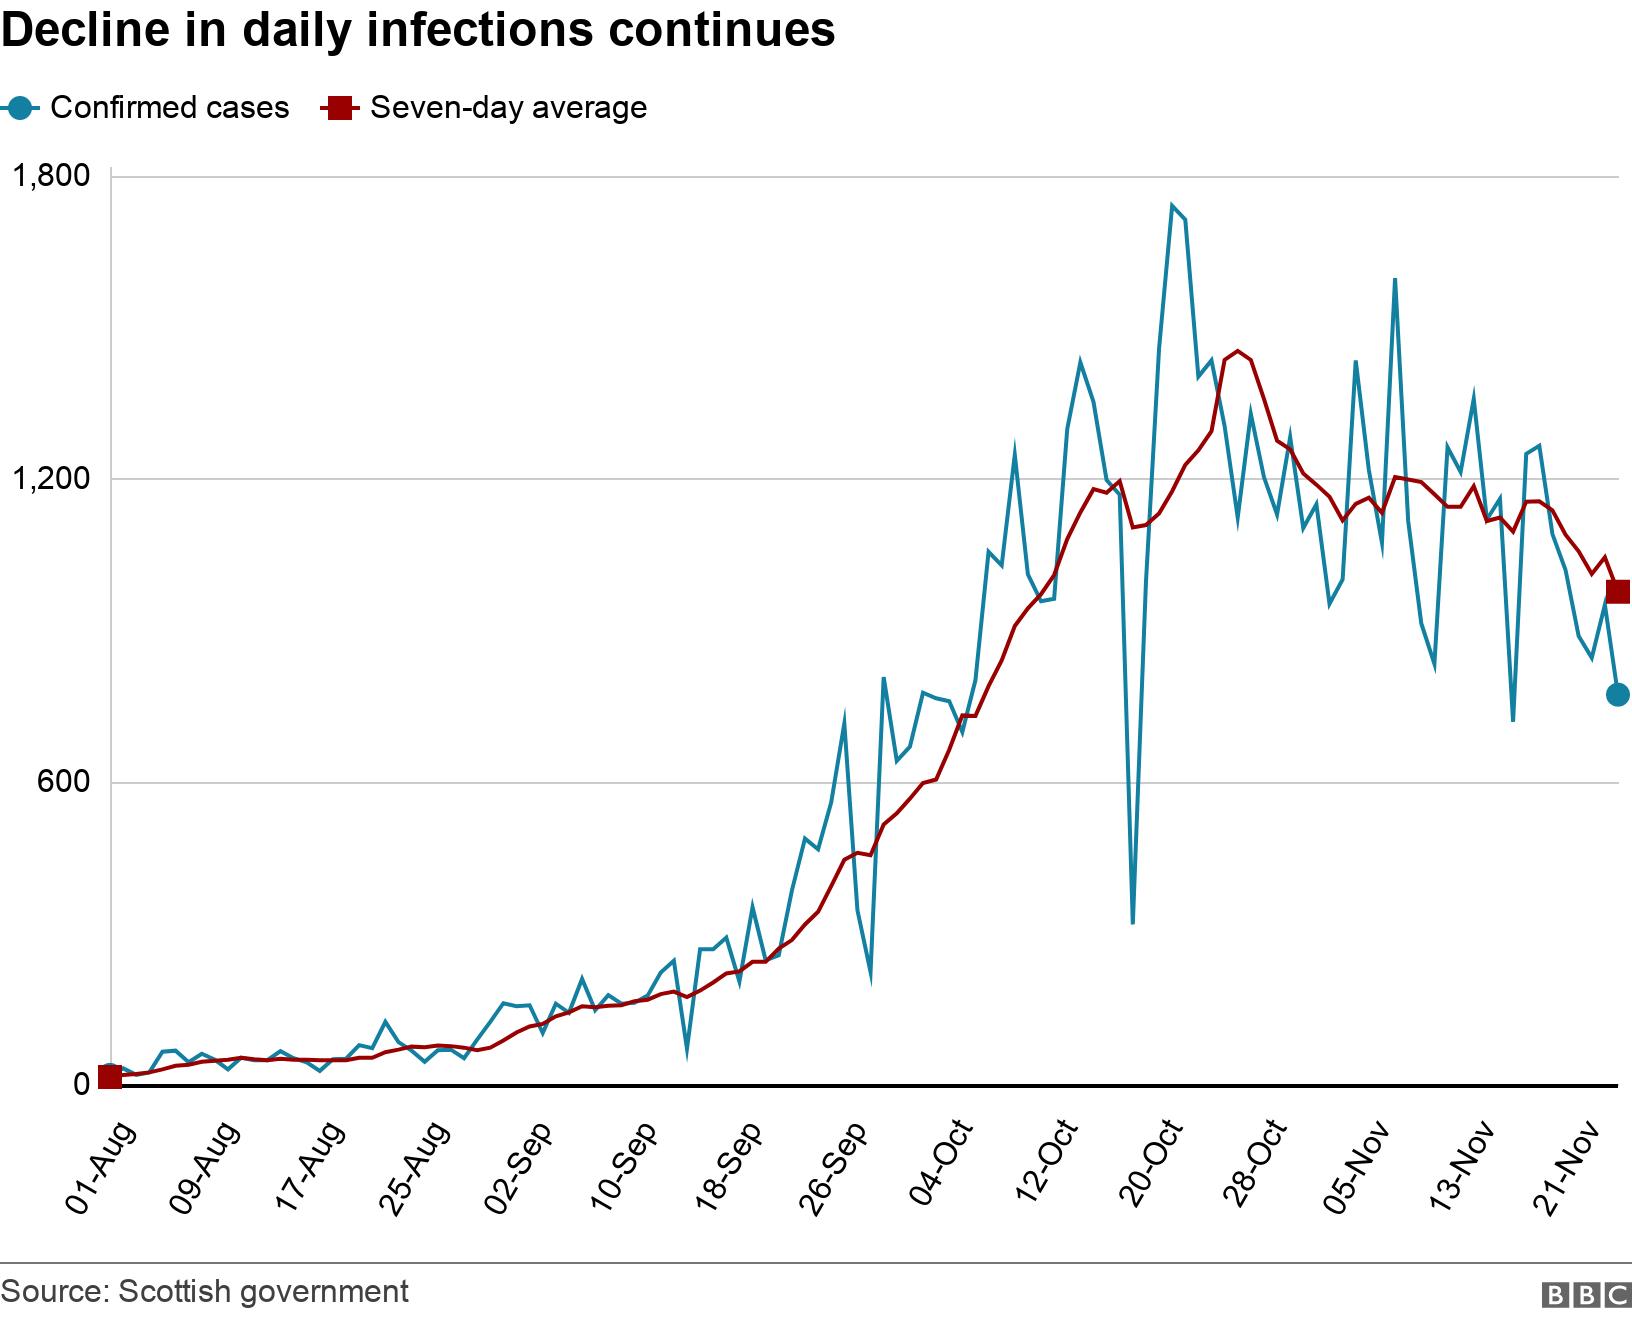
However, there are still significant areas of Scotland where cases are on the rise and this remains a concern for the Scottish government as it attempts to slow the spread of the virus.
On 20 November, the 11 local authorities with the highest infection rates were moved to level four, which has the toughest set of restrictions under Scotland's five-tier system.
The three worst-affected local authorities in level four at the end of last week were Glasgow City, North Lanarkshire, and Renfrewshire.

The infection rate in North Lanarkshire has mainly been declining since mid-October. The rate also now appears to be going down in Glasgow after several weeks at "stubbornly high" levels - as ministers have repeatedly noted.
However, there's no such decline evident in Renfrewshire, which has seen fluctuating rates between 200 and 300 cases per 100,000 since early October.
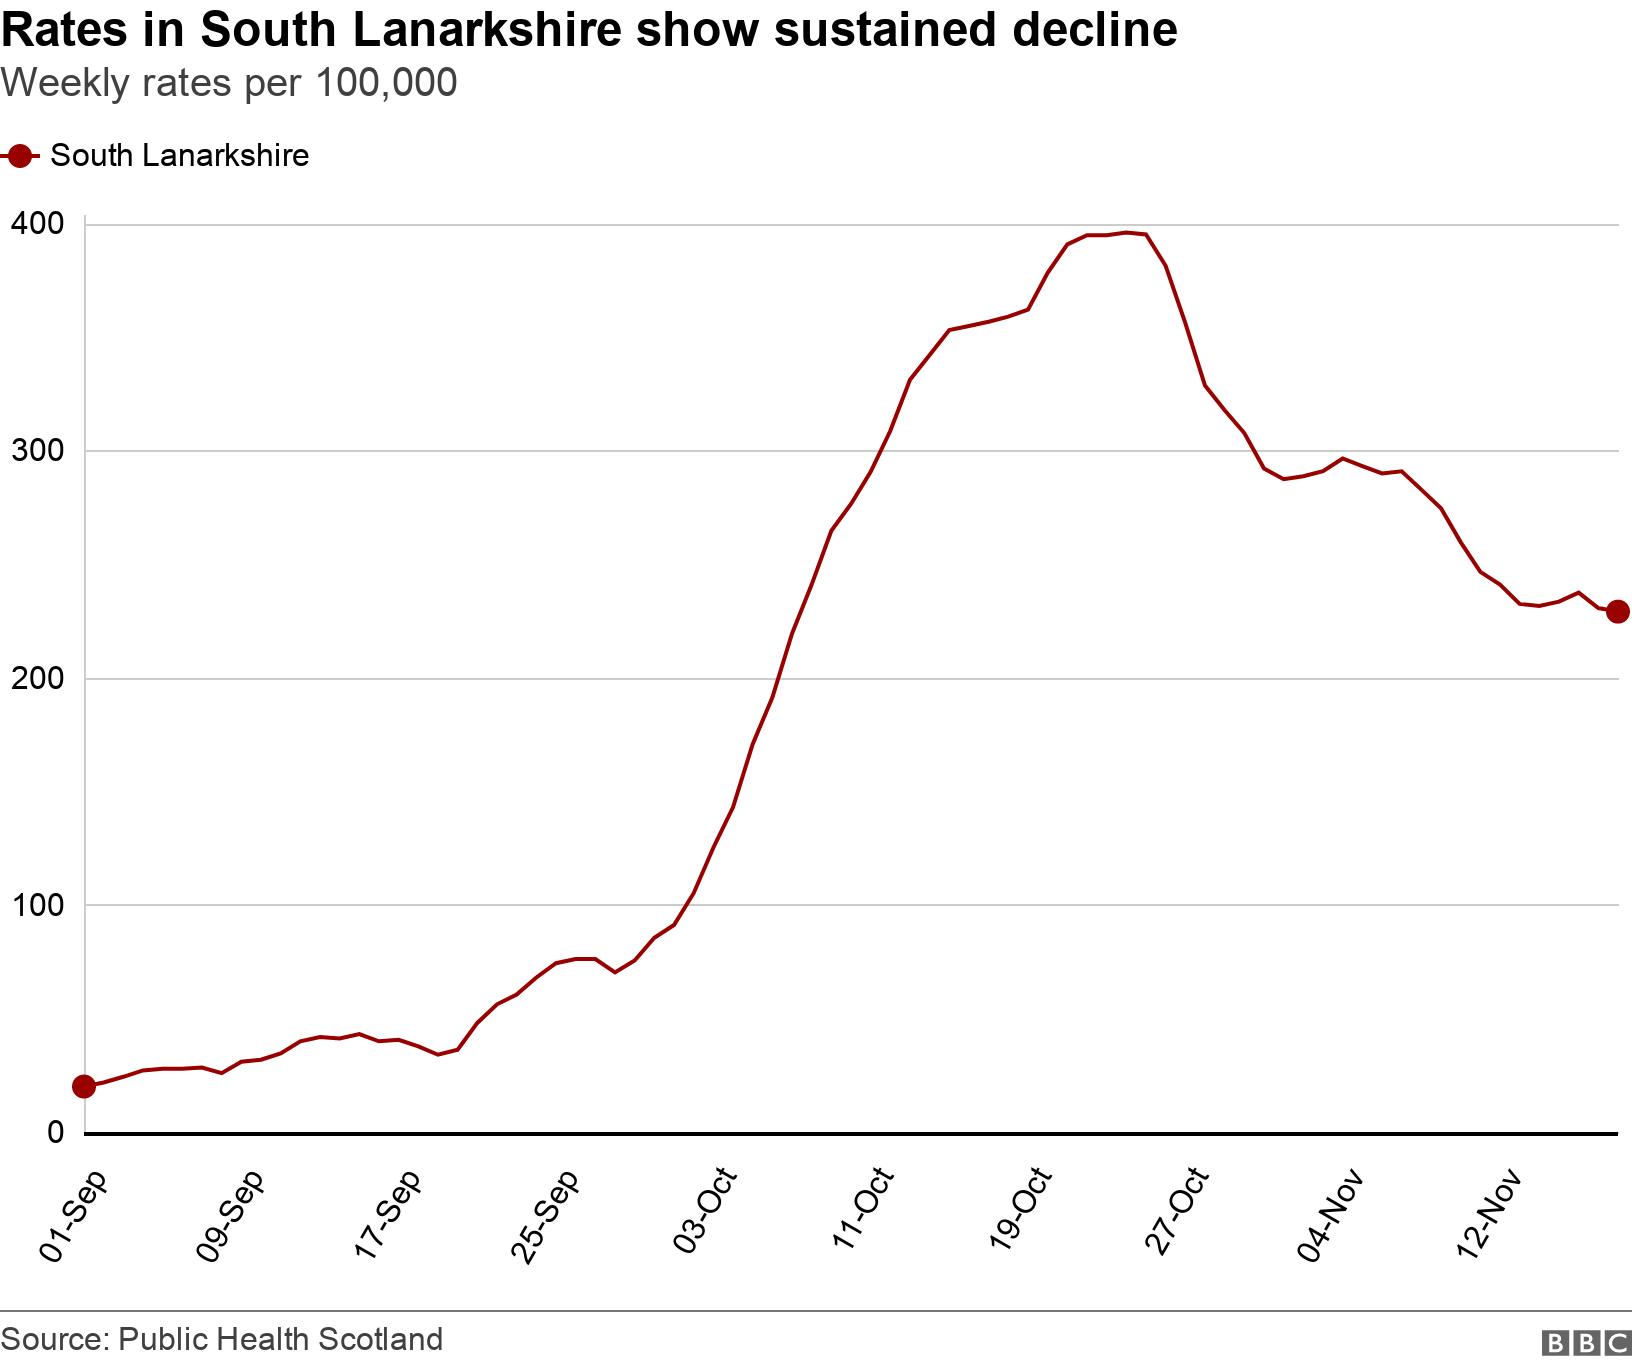
It's worth nothing that South Lanarkshire, which reached almost 400 cases per 100,000 people in October, has shown a sustained decline in infections since then.
But it's not just the local authorities with the highest rates that cause concern.
Anywhere which shows a big increase in cases over a short period will catch the attention of public health officials, who want to stop the virus becoming seated in a new community.
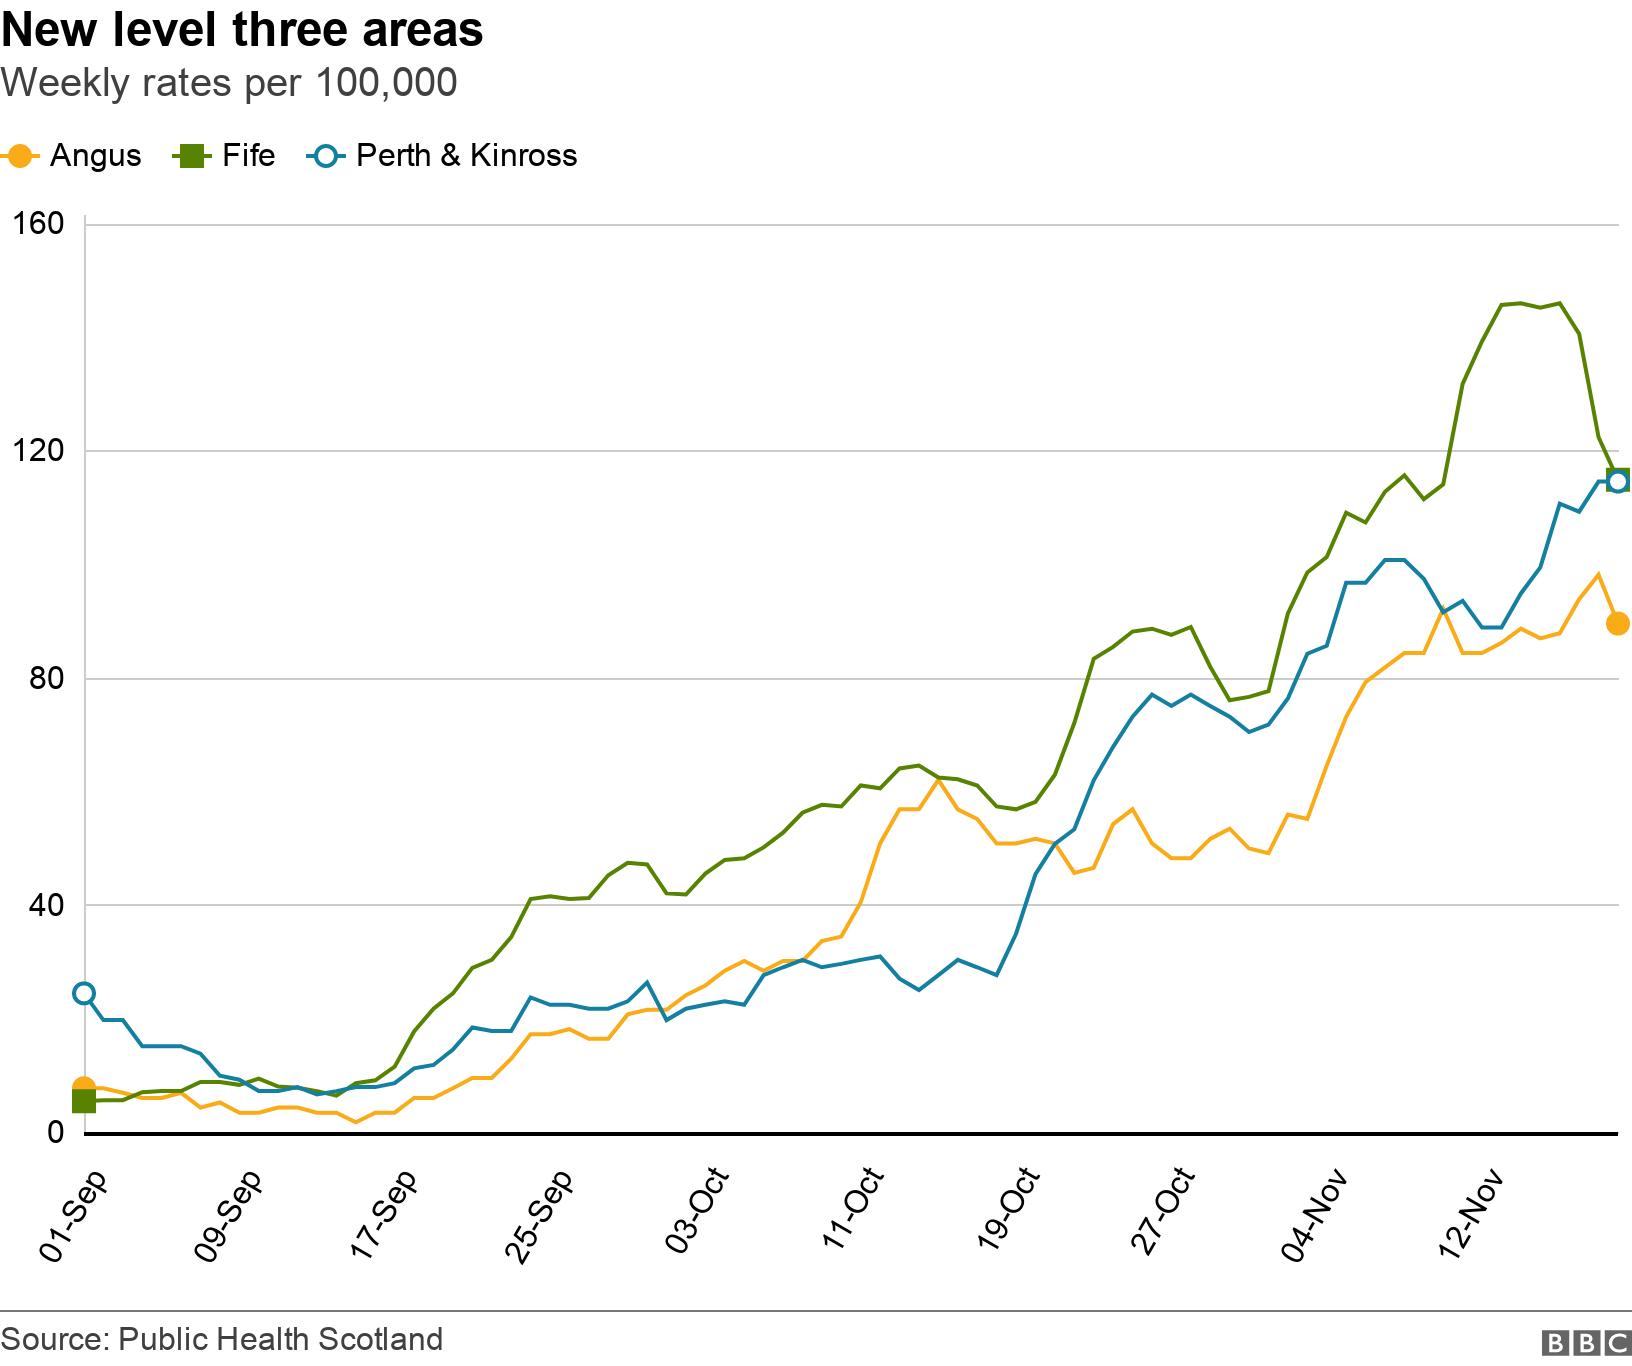
Two weeks ago the focus was on Angus, Fife and Perth and Kinross, which all moved from level two to level three restrictions after a sharp rise in cases.
Despite a dip in the number of cases in Fife, it's too soon to tell if the rate will show a sustained decline here - and in Perth and Kinross the rate is still very much on the rise.
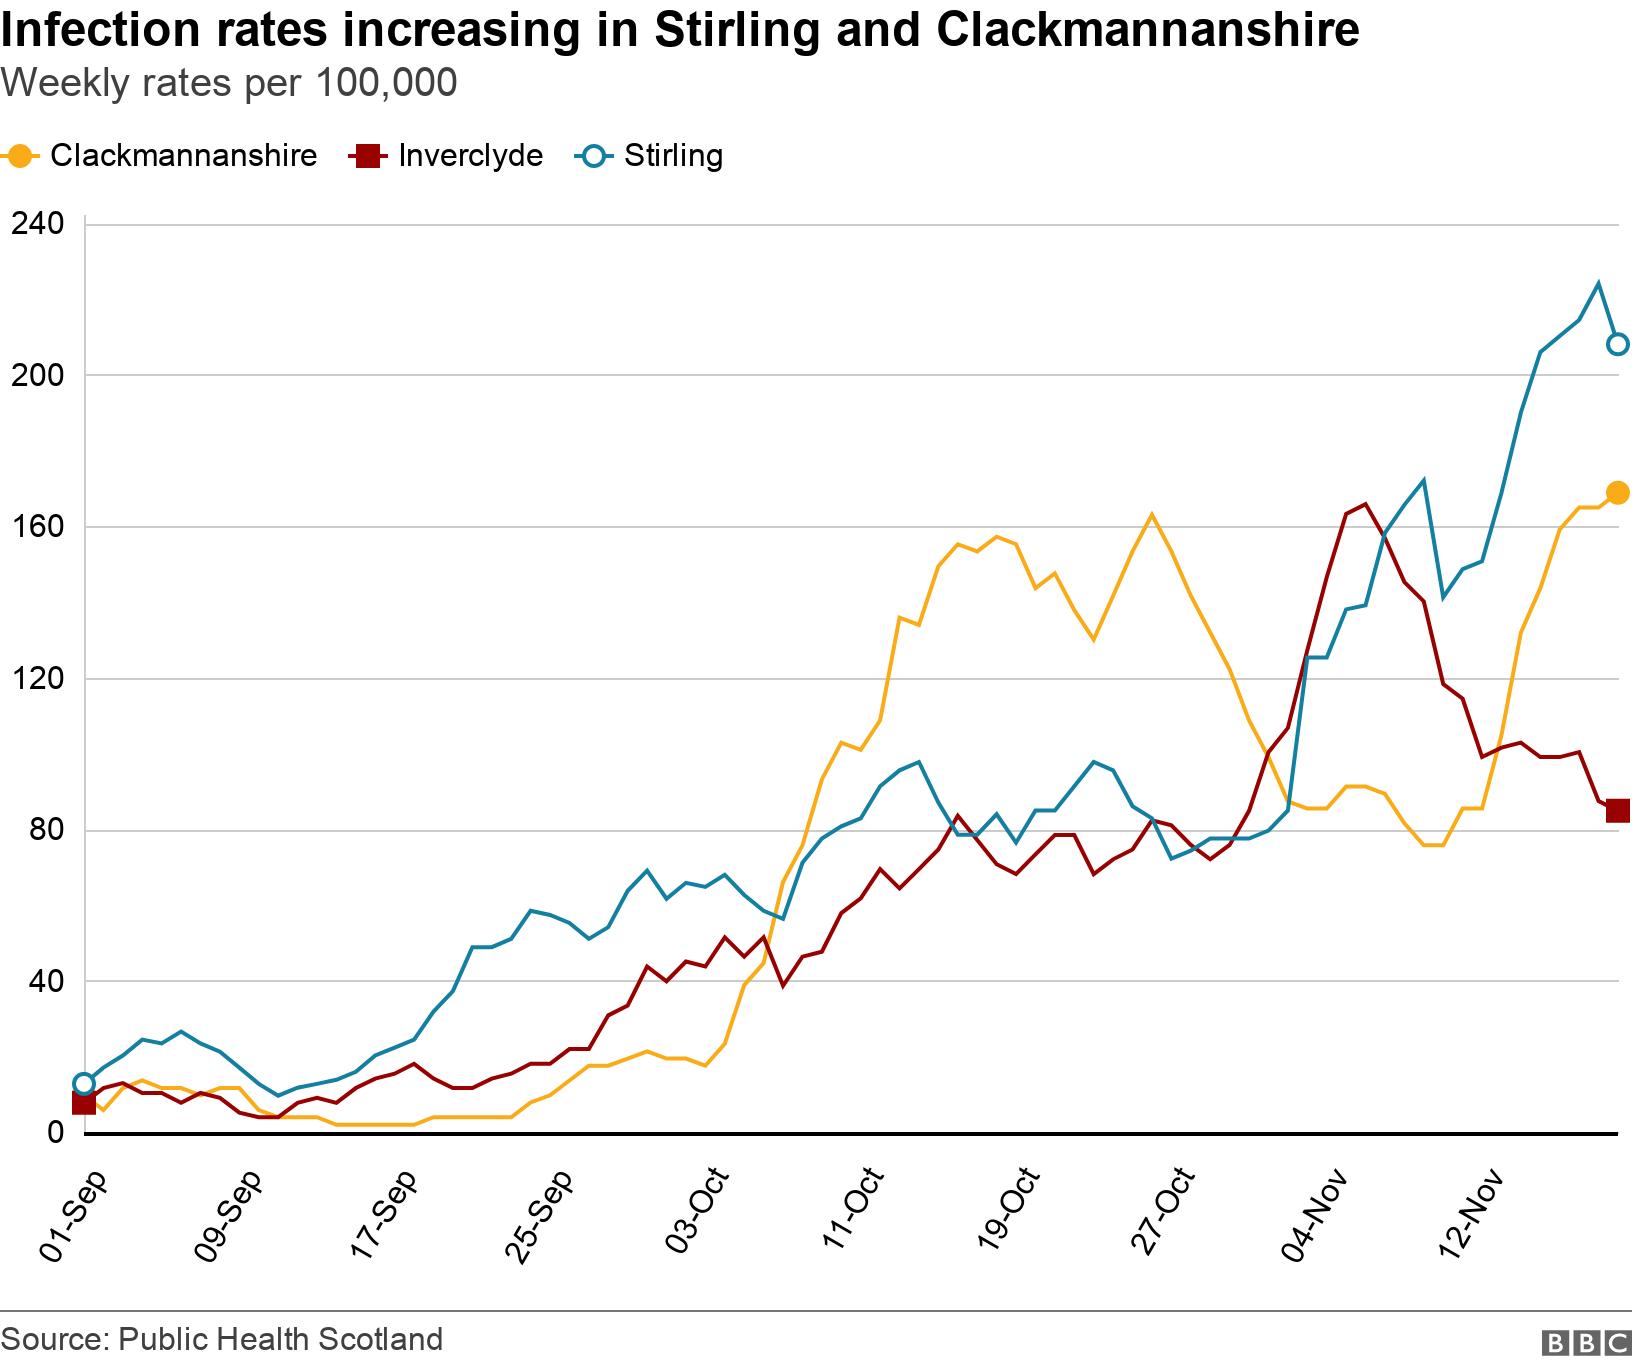
First Minister Nicola Sturgeon also highlighted significant rises in Stirling and Inverclyde.
The rate in Inverclyde is now declining, but it's still going up in Stirling - as it is in neighbouring Clackmannanshire, which up until October had seen some of the lowest infection rates across the central belt.
Infection rates are not the only indicator the Scottish government uses to review levels, but they are a key measure to watch.
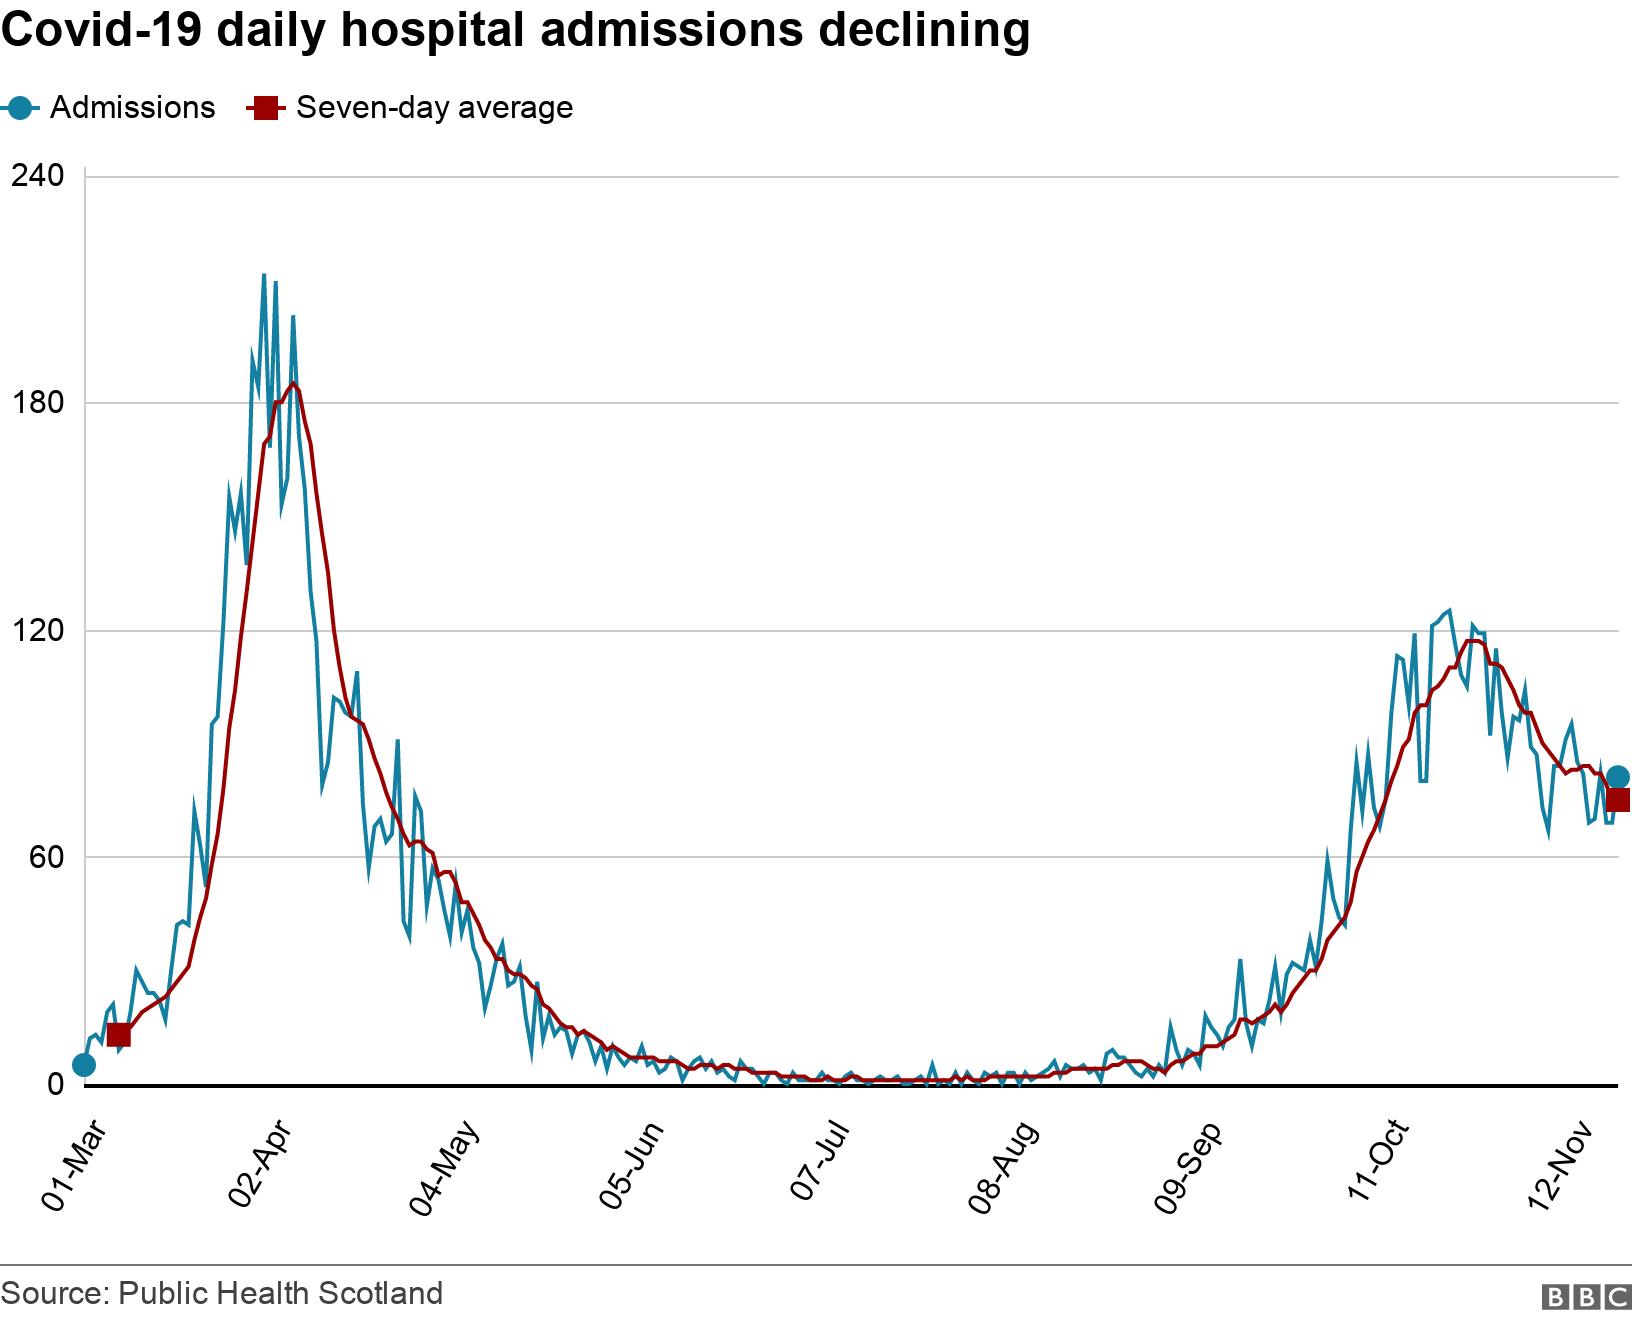
2. The number being admitted to hospital across Scotland
The daily number of new confirmed cases of Covid-19 is an important statistic - but it is difficult to make a comparison between now and March using this figure as the number of people being tested has risen so significantly.
One number that is arguably a better gauge of where Scotland is in its second wave is hospital admissions.
The daily admissions for Covid-19 in Scotland hit a low in mid-July.
They then started a slow rise which gathered pace into the autumn, but for the last two weeks the average number of admissions has mainly been going down.
If this decline is sustained, the peak will have been significantly lower than in the spring.
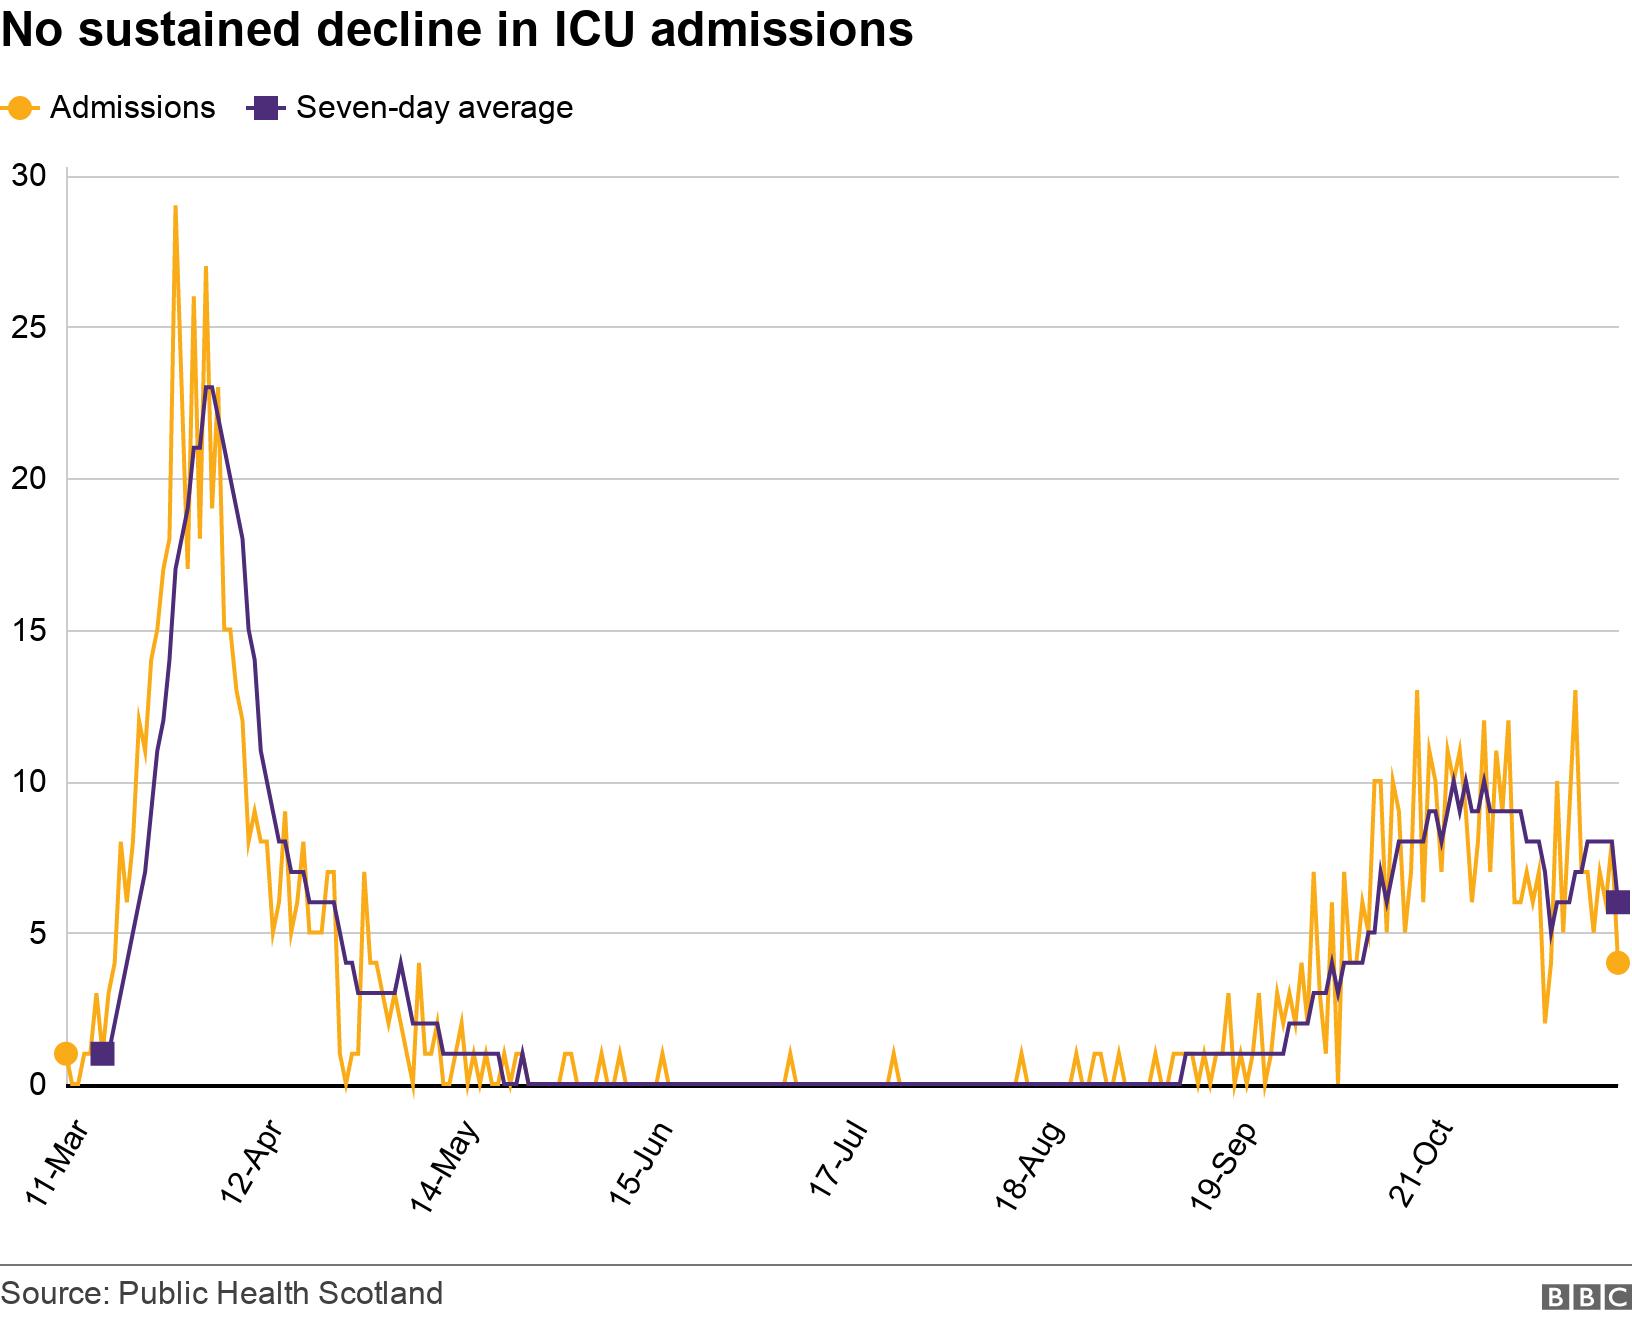
3. How many patients end up in intensive care
The sickest Covid-19 patients are likely to end up in intensive care, where the mortality rate is high.
A report by Public Health Scotland published in July, external found that almost 40% of coronavirus patients died within 30 days of being admitted to intensive care.
The number of daily ICU admissions began to rise at the end of the summer - there were six Covid-19 patients in intensive care on 11 September and there were 111 on 8 November.
Numbers have been fluctuating in the last few weeks, but there doesn't yet appear to be the same decline in ICU admissions seen in hospital admissions.
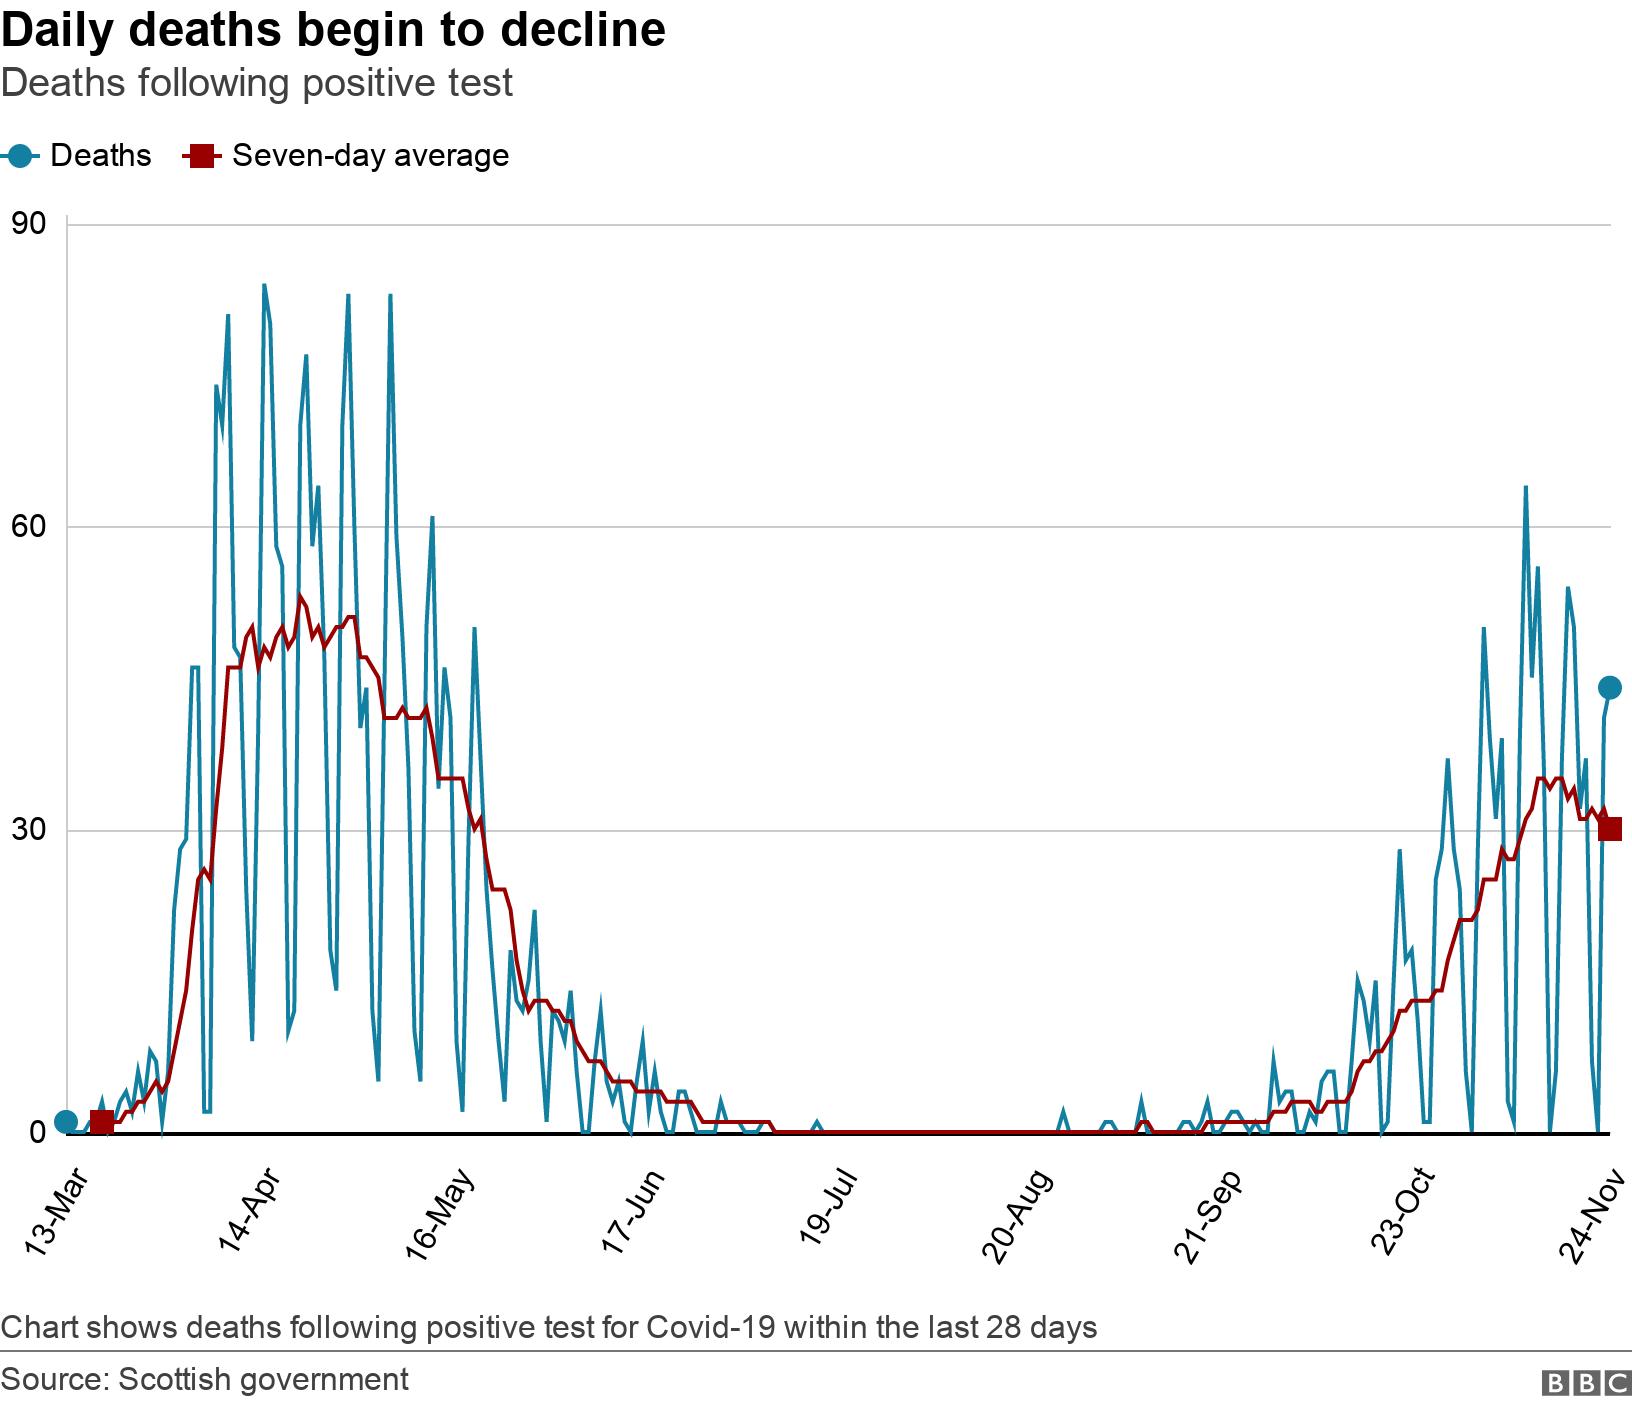
4. The number of deaths from Covid-19
The Scottish government announces daily figures of deaths within 28 days of a positive test for Covid-19.
Scotland went 40 days over the summer with no deaths recorded at all using this measure.
The average number of new Covid-19 deaths being registered each day rose steadily from mid-September, but has now begun to decline.
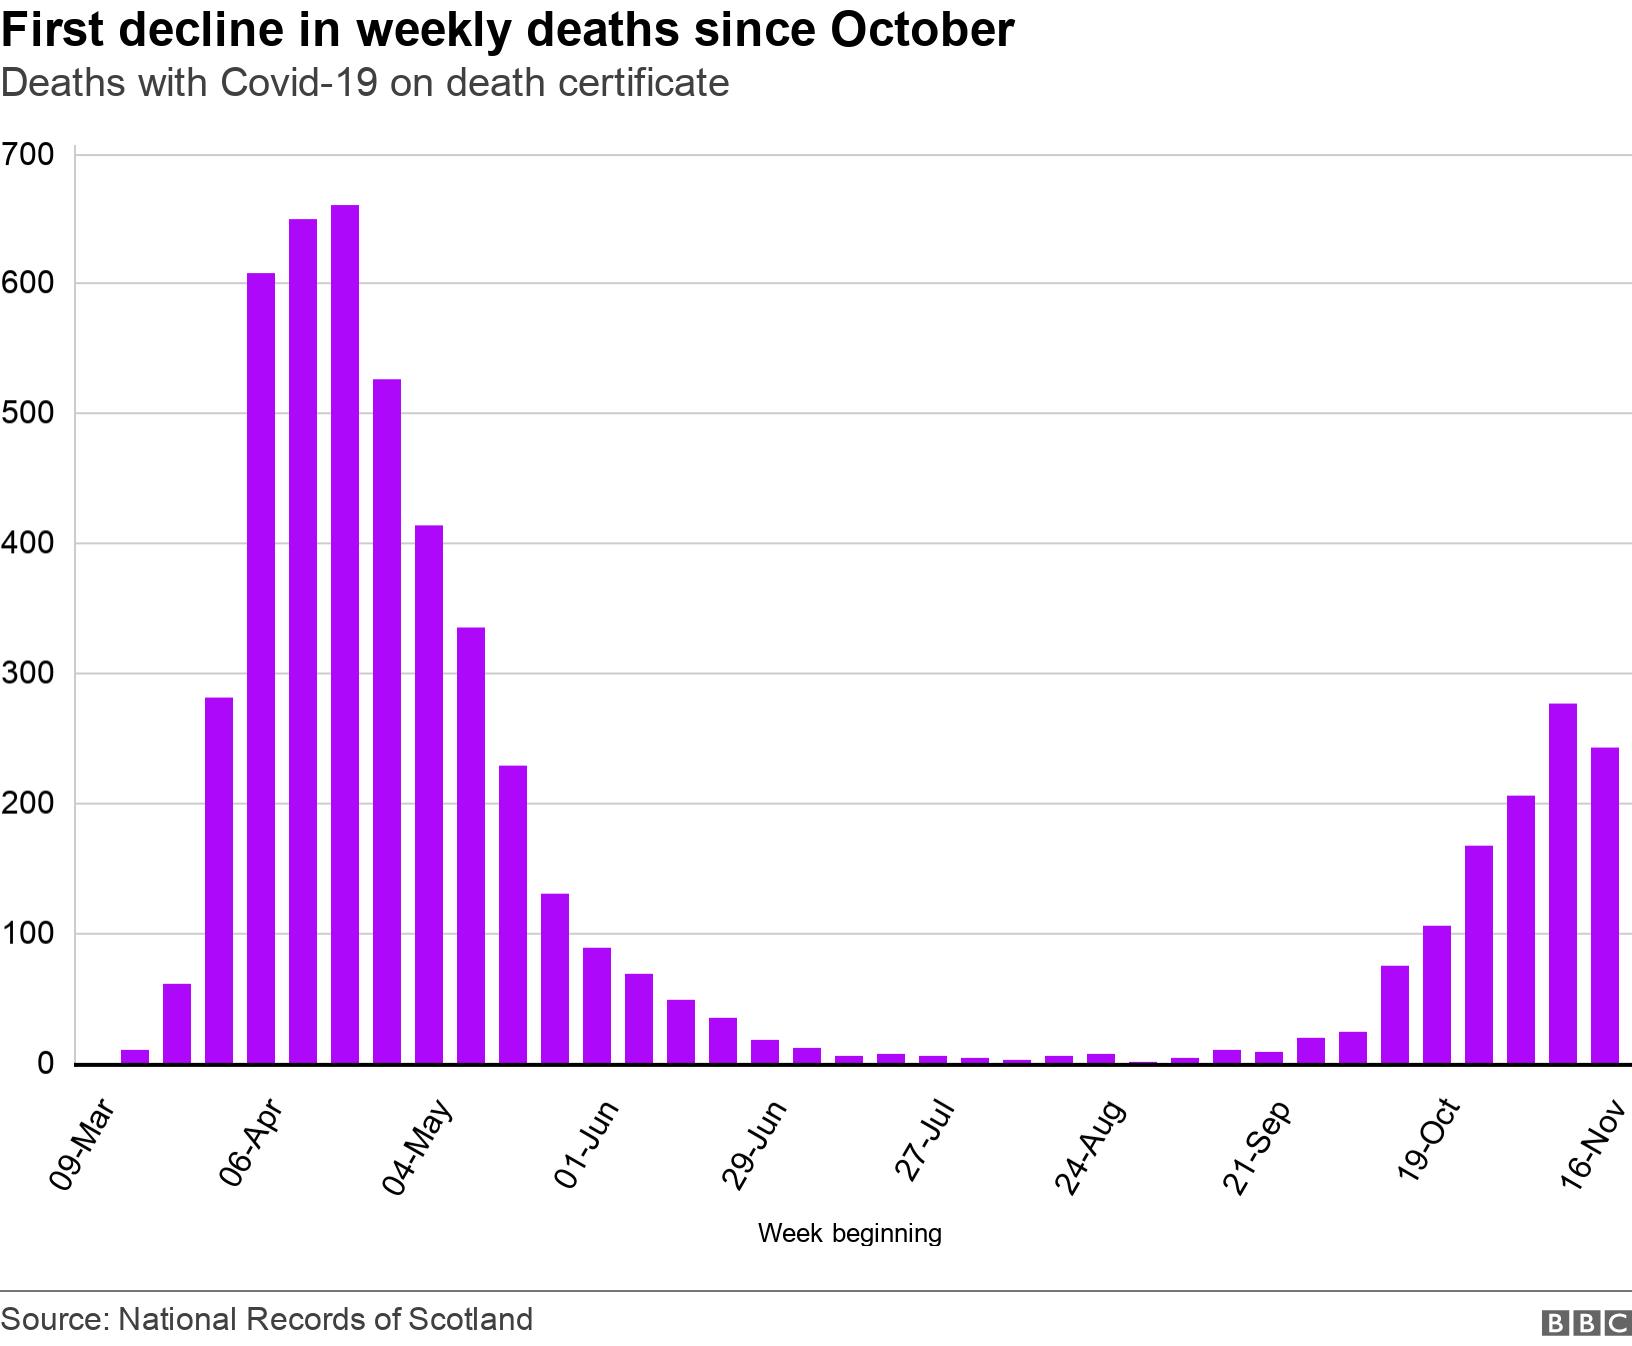
The National Records of Scotland counts all death certificates that mention Covid-19, even if the person has not been tested for the virus.
A similar pattern is evident with this measure, with the first decline in weekly deaths since the beginning of October recorded last week.
5. Who is getting infected?
It appears that daily hospital admissions have peaked at a much lower rate than they did in the spring, so why is that when the number of new cases has undoubtedly surged in the past two months?
One reason could be that fewer over-65s are being infected now than they were in the early stages of Scotland's pandemic in the spring.
Younger age groups are much less likely to end up in hospital, or die, from Covid-19.
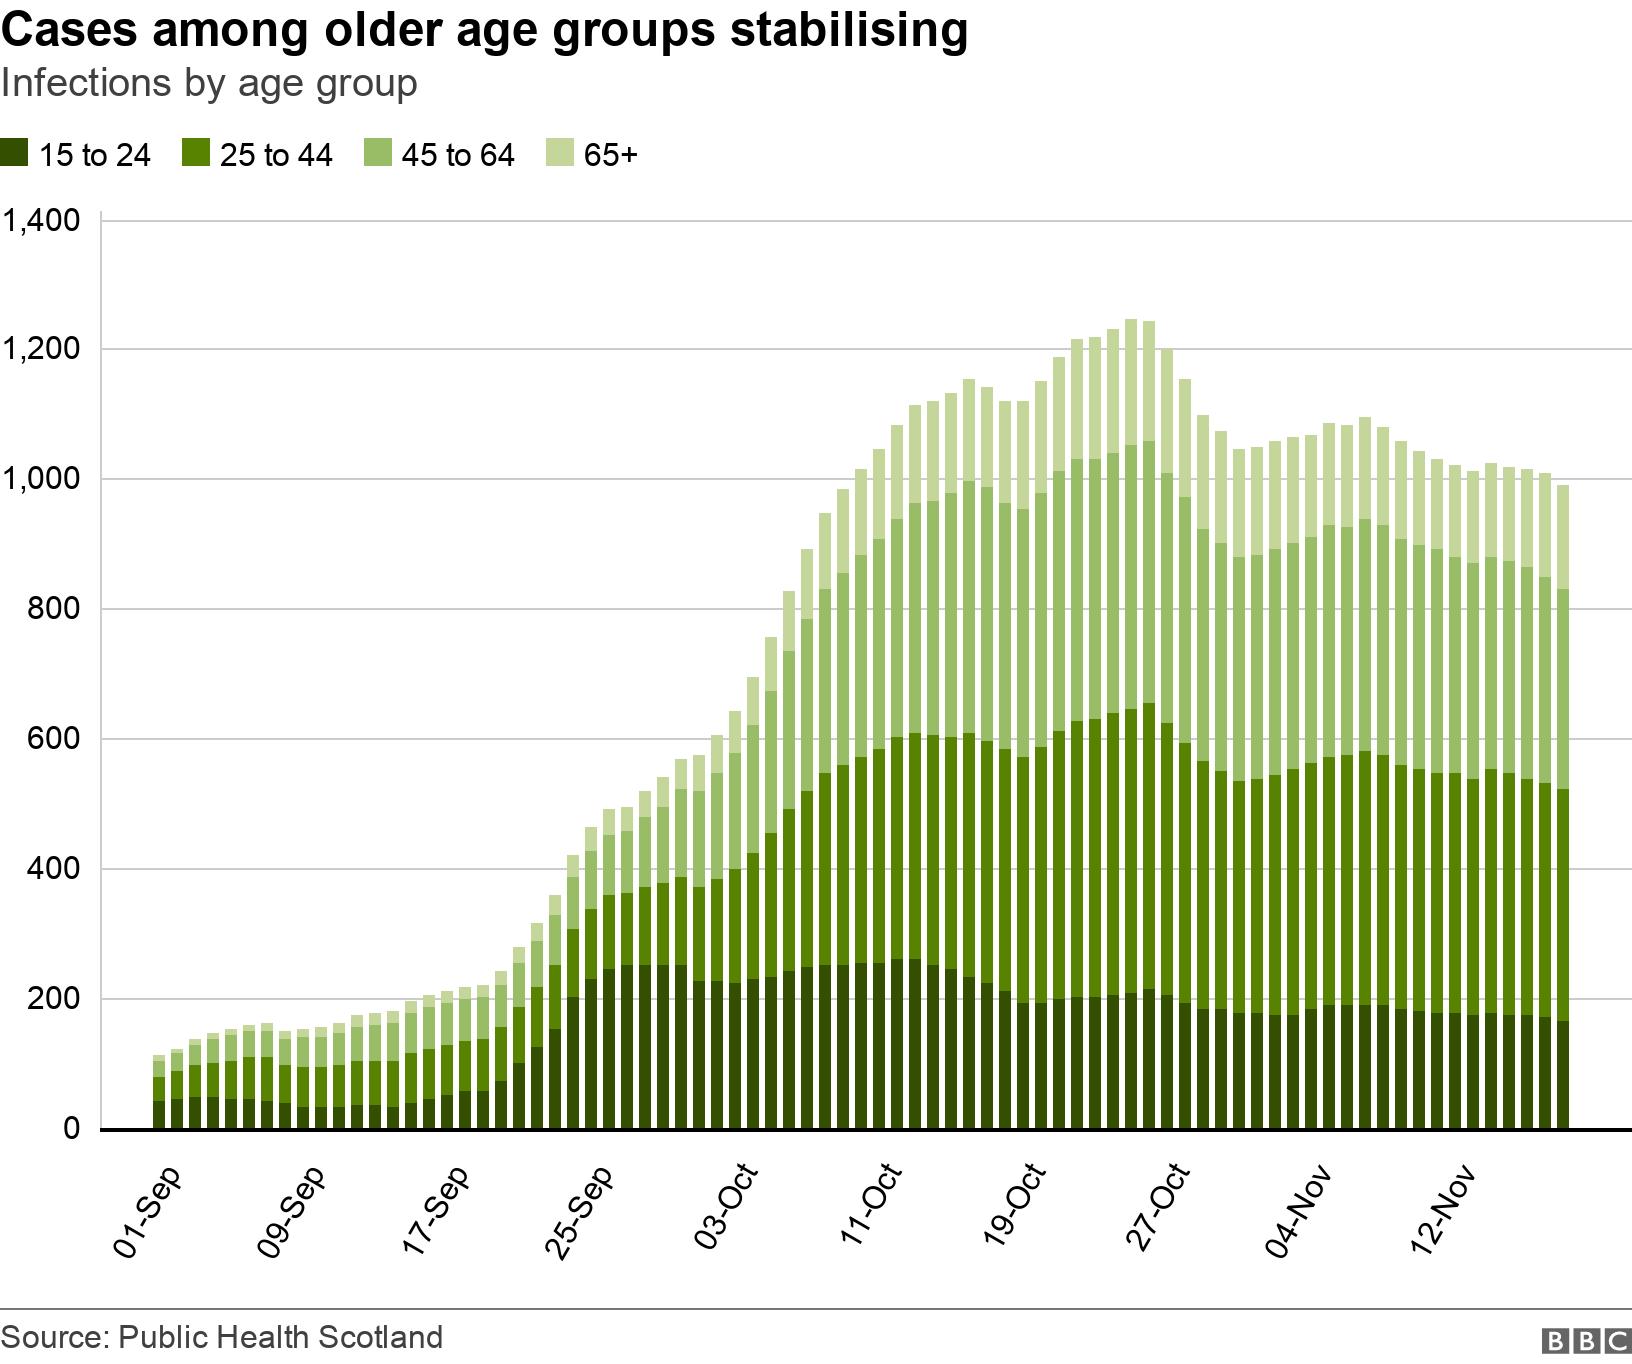
This next chart shows that there were more infections among younger age groups at the start of Scotland's second wave, with that steep rise in mid-September driven by outbreaks in student accommodation.
Infection rates among older age groups began to rise in September and October, but now appear to have stabilised.
So has Scotland's second wave peaked?
The decline in both death rates and hospital admissions is encouraging, but there are significant risks ahead.
Local outbreaks are still occurring and health officials will be very aware that the relaxation of restrictions over Christmas will likely cause an increase in infections.
The Scottish government and NHS Scotland will be working to drive cases as low as possible before Christmas to avoid that increase turning into a new surge.

