Price inflation: what goes down...
- Published

It's 55 years since we last saw prices falling. It didn't last long, and nor is the deflation of prices announced this week by the Office for National Statistics.
Economists will tell you that deflation is generally a Very Bad Thing. Once people start anticipating that prices will be lower in future, they put off buying goods.
That sucks demand out of the economy, and you're into a vicious spiral. As Japan has shown over the past two decades, it's very hard to get out of that.
But economists are agreed that the latest ONS statistics are not a cause for concern. Not yet anyway. The fall in prices is explained by lower food costs, as supermarkets battle for our price-sensitive custom, and lower oil prices.
The purchase of neither food nor fuel is easily postponed. So the spending continues. If you look at new car registrations, they're doing very heathily. If deflation were about to take hold, we'd be putting off buying cars until the price drops.
And when the governor of the Bank of England says he anticipates inflation returning towards his 2% target, that's because the comparison of last month's fuel costs with last year's fuel costs will not show a drop by the end of this year. On the contrary, it looks like showing a significant increase.
Wars boost prices
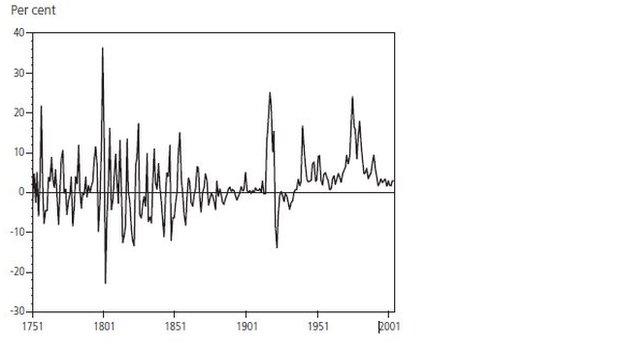
The rarity of deflating prices is a modern phenomenon. The ONS has studied price inflation since 1750, and it's been quite a rocky ride. Wars inflate prices, as do poor harvests. But good harvests can inflate prices. This ONS chart shows how much volatility there has been.

Composite Price Index: annual percentage change: 1751 to 2003


The biggest spike is for the Napoleonic wars, when prices went up 50% between 1803 and 1815. After the outbreak of war in 1914, prices doubled in six years. But the 1920s and 1930s depression pulled prices down, as demand slumped, and unemployment brought wages down.
The last full year of falling prices in Britain was 1936. Since then, prices have consistently risen year-to-year (albeit with that dip for a few months in 1960).
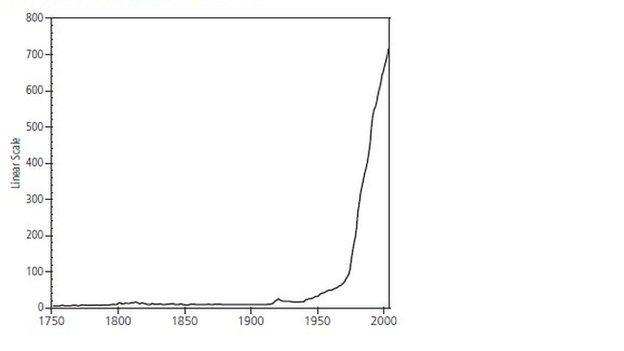
So for the period from 1750 to World War Two, prices rose a bit more than three-fold. But since then, prices have gone up more than 40-fold.

Composite Price Index 1750 to 2003, January 1974=100 (linear scale)


The big inflationary spike came in 1973, and it was global. The Arab-led oil embargo on the West pushed up fuel prices four-fold. Strong trade unions demanded that they keep their spending power by matching inflation and then pushing up by comparison with others. Between 1973 and 1981, there was only one year with inflation below 10%. It peaked at 24% in 1975.
The essence of Thatcherism was to tame inflation, with a squeeze on the money supply and on trade unions. We now have much lower trade union membership (below 20% of workers in the private sector) and globalisation has pushed down prices for household goods. As manufacturing has shifted to cheaper locations, we have been through an unusually benign period of low inflation, though a less benign period of real wage stagnation and more job insecurity.
Basket weaving
The other big change to the inflation measure over recent decades is what gets measured. That reflects how we spend our disposable income, and with post-1945 prosperity, we're spending a lot less on the essentials. The spend on food has fallen from 35 to 40% to below 12%. That doesn't mean less is spent on food, but that a lower proportion of household budgets.
Tobacco has fallen from 12% to less than 3% of household budgets since 1947. After the end of wartime rationing, clothing and footwear took up 11% of spending by the late 1950s, but is now below half that level. And while we're drinking a lot more alcohol, we're spending less of our pay packets on it, down from 10% in the late 1940s to 7% by 2004.

What are we spending more on? Housing has seen the big surge, as housing ownership has grown, and so have prices in real terms. When Attlee was Prime Minister, that took up 9% of the total. By the time Tony Blair was in office, it was 22%.
Transport is up a lot over that period, from 3% to 16%. Foreign holidays were introduced into the ONS basket of goods and services as recently as 1993.
And the spend on household gadgets is up. In 1947, the basket included vacuum cleaners, an iron, radio set and gramophone. A black and white TV was added in the 1950s, along with a washing machine, with the fridge added in the 1960s.
There's an annual revision of the basket, to drop out-of-date goods and to introduce new ones. The most recent one saw sat-navs, frozen pizza and white emulsion paint fall out the basket. Apparently, we're going for more colour these days, and buying our pizzas chilled. Thrown into the basket is streaming music and craft beer - though you have to imagine that craft beer was probably a significant part of the inflationary basket for the ONS's predecessors in 1750.
Knowns and unknowns
What's known about the near term is that the rising oil price should inject some inflation into the basket of goods and services measured by the ONS.
What's not clear is the potential inflationary effect of creating new money, through quantitative easing. So far, it has confounded those who fear a sudden spurt of inflation. But with low interest rates and all that newly created money to be unwound as the economy recovers, we are in unknown territory for economists.