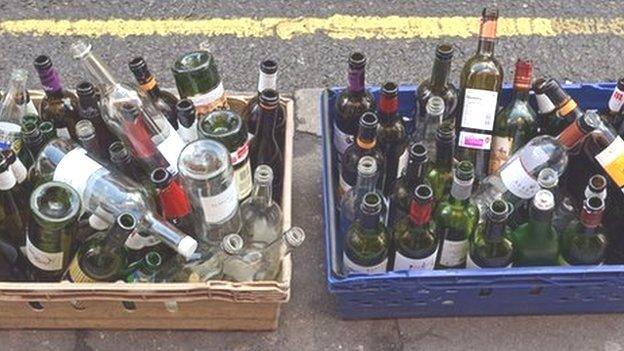
Landfill figures for Welsh councils revealed
- Published
The amount spent by councils on landfill has fallen by at least 22% in the last four years, according to figures obtained by BBC Wales.
The total weight of landfill has dropped from 641,000 tonnes in 2012/13 to 450,000 tonnes in 2014-15, external - a 30% fall in three years.
Since, 2011/12, the annual cost has dropped from more than £59m to £46m.
The Welsh government said Wales was "continuing to lead the way in the UK".
While most councils have cut their landfill bill since 2011/12, others have seen theirs remain flat or rise.
Here are the full figures:
ANGLESEY
2014-15 - £1,718,700
2013-14 - £1,598,800
2012-13 - £1,631,100
2011-12 - £1,725,000
Percentage change over last four years: Down 0.36%
BLAENAU GWENT
2014-15 - £114,600
2013-14 - £153,800
2012-13 - £1,400,700
2011-12 - £598,000
Percentage change over last four years: Down 80%
BRIDGEND
2014-15 - £719,000
2013-14 - £655,400
2012-13 - £608,500
2011-12 - £818,100
Percentage change over last four years: Down 12%
CAERPHILLY
2014-15 - £1,842,900
2013-14 - £3,107,600
2012-13 - £2,947,900
2011-12 - £2,800,010
Percentage change over last four years: Down 34%
CARDIFF
2014-15 - £5,261,800
2013-14 - £6,843,600
2012-13 - £6,312,800
2011-12 - £7,450,400
Percentage change over last four years: Down 29%
CARMARTHENSHIRE
2014-15 - £1,331,300
2013-14 - £3,025,500
2012-13 - £2,826,500
2011-12 - £2,833,800
Percentage change over last four years: Down 53%
CEREDIGION
Ceredigion council said the figures it spent on landfill over the last four years could not be provided because they were part of a "commercial contract".
CONWY
2014-15 - £3,170,000
2013-14 - £2,800,000
2012-13 - £2,700,000
2011-12 - £2,500.000*
Percentage change over last four years: Up 26%
*Conwy said the rise was attributable to increases in landfill disposal tax, not an increase in waste.
DENBIGHSHIRE
2014-15 - £1,424,000*
2013-14 - £1,437,000
2012-13 - £1,516,000
2011-12 - £1,324,000
Percentage change over last four years: Up 7%
*Denbighshire said the rise was attributable to increases in landfill disposal tax, not an increase in waste.
FLINTSHIRE
2014-15 - £3,191,500
2013-14 - £3,109,100
2012-13 - £2,854,400
2011-12 - £6,963,500
Percentage change over last four years: Down 54%.
GWYNEDD
2014-15 - £1,570,000 plus landfill gate fee*
2013-14 - £1,495,800 plus landfill gate fee
2012-13 - £1,328,800 plus landfill gate fee
2011-12 - Figure not provided
Percentage change over last three years: Up 18%
*Gwynedd said the rise was attributable to increases in landfill disposal tax, not an increase in waste.
MERTHYR TYDFIL
2014-15 - £1,504,000
2013-14 - £1,459,000
2012-13 - £1,428,000
2011-12 - £1,515,000
Percentage change over last four years: Down 0.7%
MONMOUTHSHIRE
Kerbside waste from Monmouthshire was sent to an Energy From Waste, external plant in 2014/15, and not landfill, at a cost of £630,000
Equivalent figures:
2013-14 - £910,000
2012-13 - £1,350,000
2011-12 - £1,200,000
Percentage change over last four years: Down 47.5%
NEATH PORT TALBOT
Neath Port Talbot pays for waste disposal through a council owned arms-length company which takes care of recycling, waste treatment and disposal through landfill. The amount for landfill alone is not available.
2014-15 - £4,316,000
2013-14 - £4,316,000
2012-13 - £4,591,500
2011-12 - £4,733,600
Percentage change over last four years: Down 9%
NEWPORT
2014-15 - £2,400,000
2013-14 - £3,400,000
2012-13 - £3,500,000
2011-12 - £3,300,000
Percentage change over last four years: Down 27%
PEMBROKESHIRE
2014-15 - £653,100
2013-14 - £1,390,800
2012-13 - £1,845,000
2011-12 - £1,749,700
Percentage change over last four years: Down 62%
POWYS
2014-15 - £1,604,400
2013-14 - £1,556,200
2012-13 - £1,517,340
2011-12 - : £1,729,400
Percentage change over last four years: Down 8%
RHONDDA CYNON TAF
2014-15 - £3,107,400
2013-14 - £3,212,400
2012-13 - £3,084,800
2011-12 - £3,591,200
Percentage change over last four years: Down 13.4%
SWANSEA
2014-15 - £6,084,600
2013-14 - £5,412,100
2012-13 - £6,102,600
2011-12 - £6,014,800
Percentage change over last four years: Down 1%
TORFAEN
2014-15 - £269,100 (landfill), £2,054,500 (Energy from Waste)
2013-14 - £211,300 (landfill), £2,008,300 (Energy from Waste)
2012-13 - £2,566,983,
2011-12 - £2,515,100
Percentage change over last four years: Down 89%
VALE OF GLAMORGAN
2014-15 - £3,066,800
2013-14 - £3,430,100
2012-13 - £3,086,900
2011-12 - £3,007,000
Percentage change over last four years: Up 2%.
WREXHAM
2014-15 - £4,389,000
2013-14 - £4,722,900
2012-13 - £5,279,700
2011-12 - £6,168,700
Percentage change over last four years: Down 29%
- Published20 August 2015
- Published20 August 2015
- Published12 May 2015
- Published20 August 2015
