The 'gigantic' Milky Way map that's taken 13 years to create
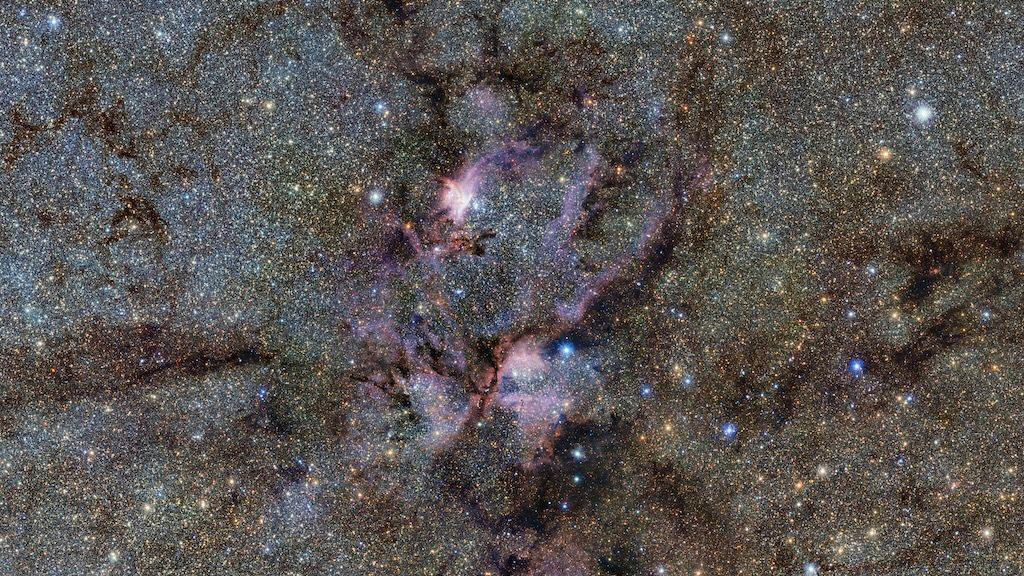
A celestial landscape of glowing clouds of gas, dust and young stars
- Published
School projects can take time to complete, but imagine working on one for more than 13 years!
Well that's what a group of astronomers have done in order to publish a gigantic map of our galaxy, the Milky Way.
Scientists say the work has revealed discoveries that have changed their view of the galaxy "forever".
The infrared map contains more than 1.5 billion objects, including newborn stars, making it the most detailed map of the Milky Way ever created.
More marvellous Milky Way stories
Milky Way Photographer of the Year 2024 pictures revealed
- Published21 May 2024
Exploring the 'ancient threads' of the Milky Way
- Published21 March 2024
Super speedy space object surprises scientists
- Published20 August 2024
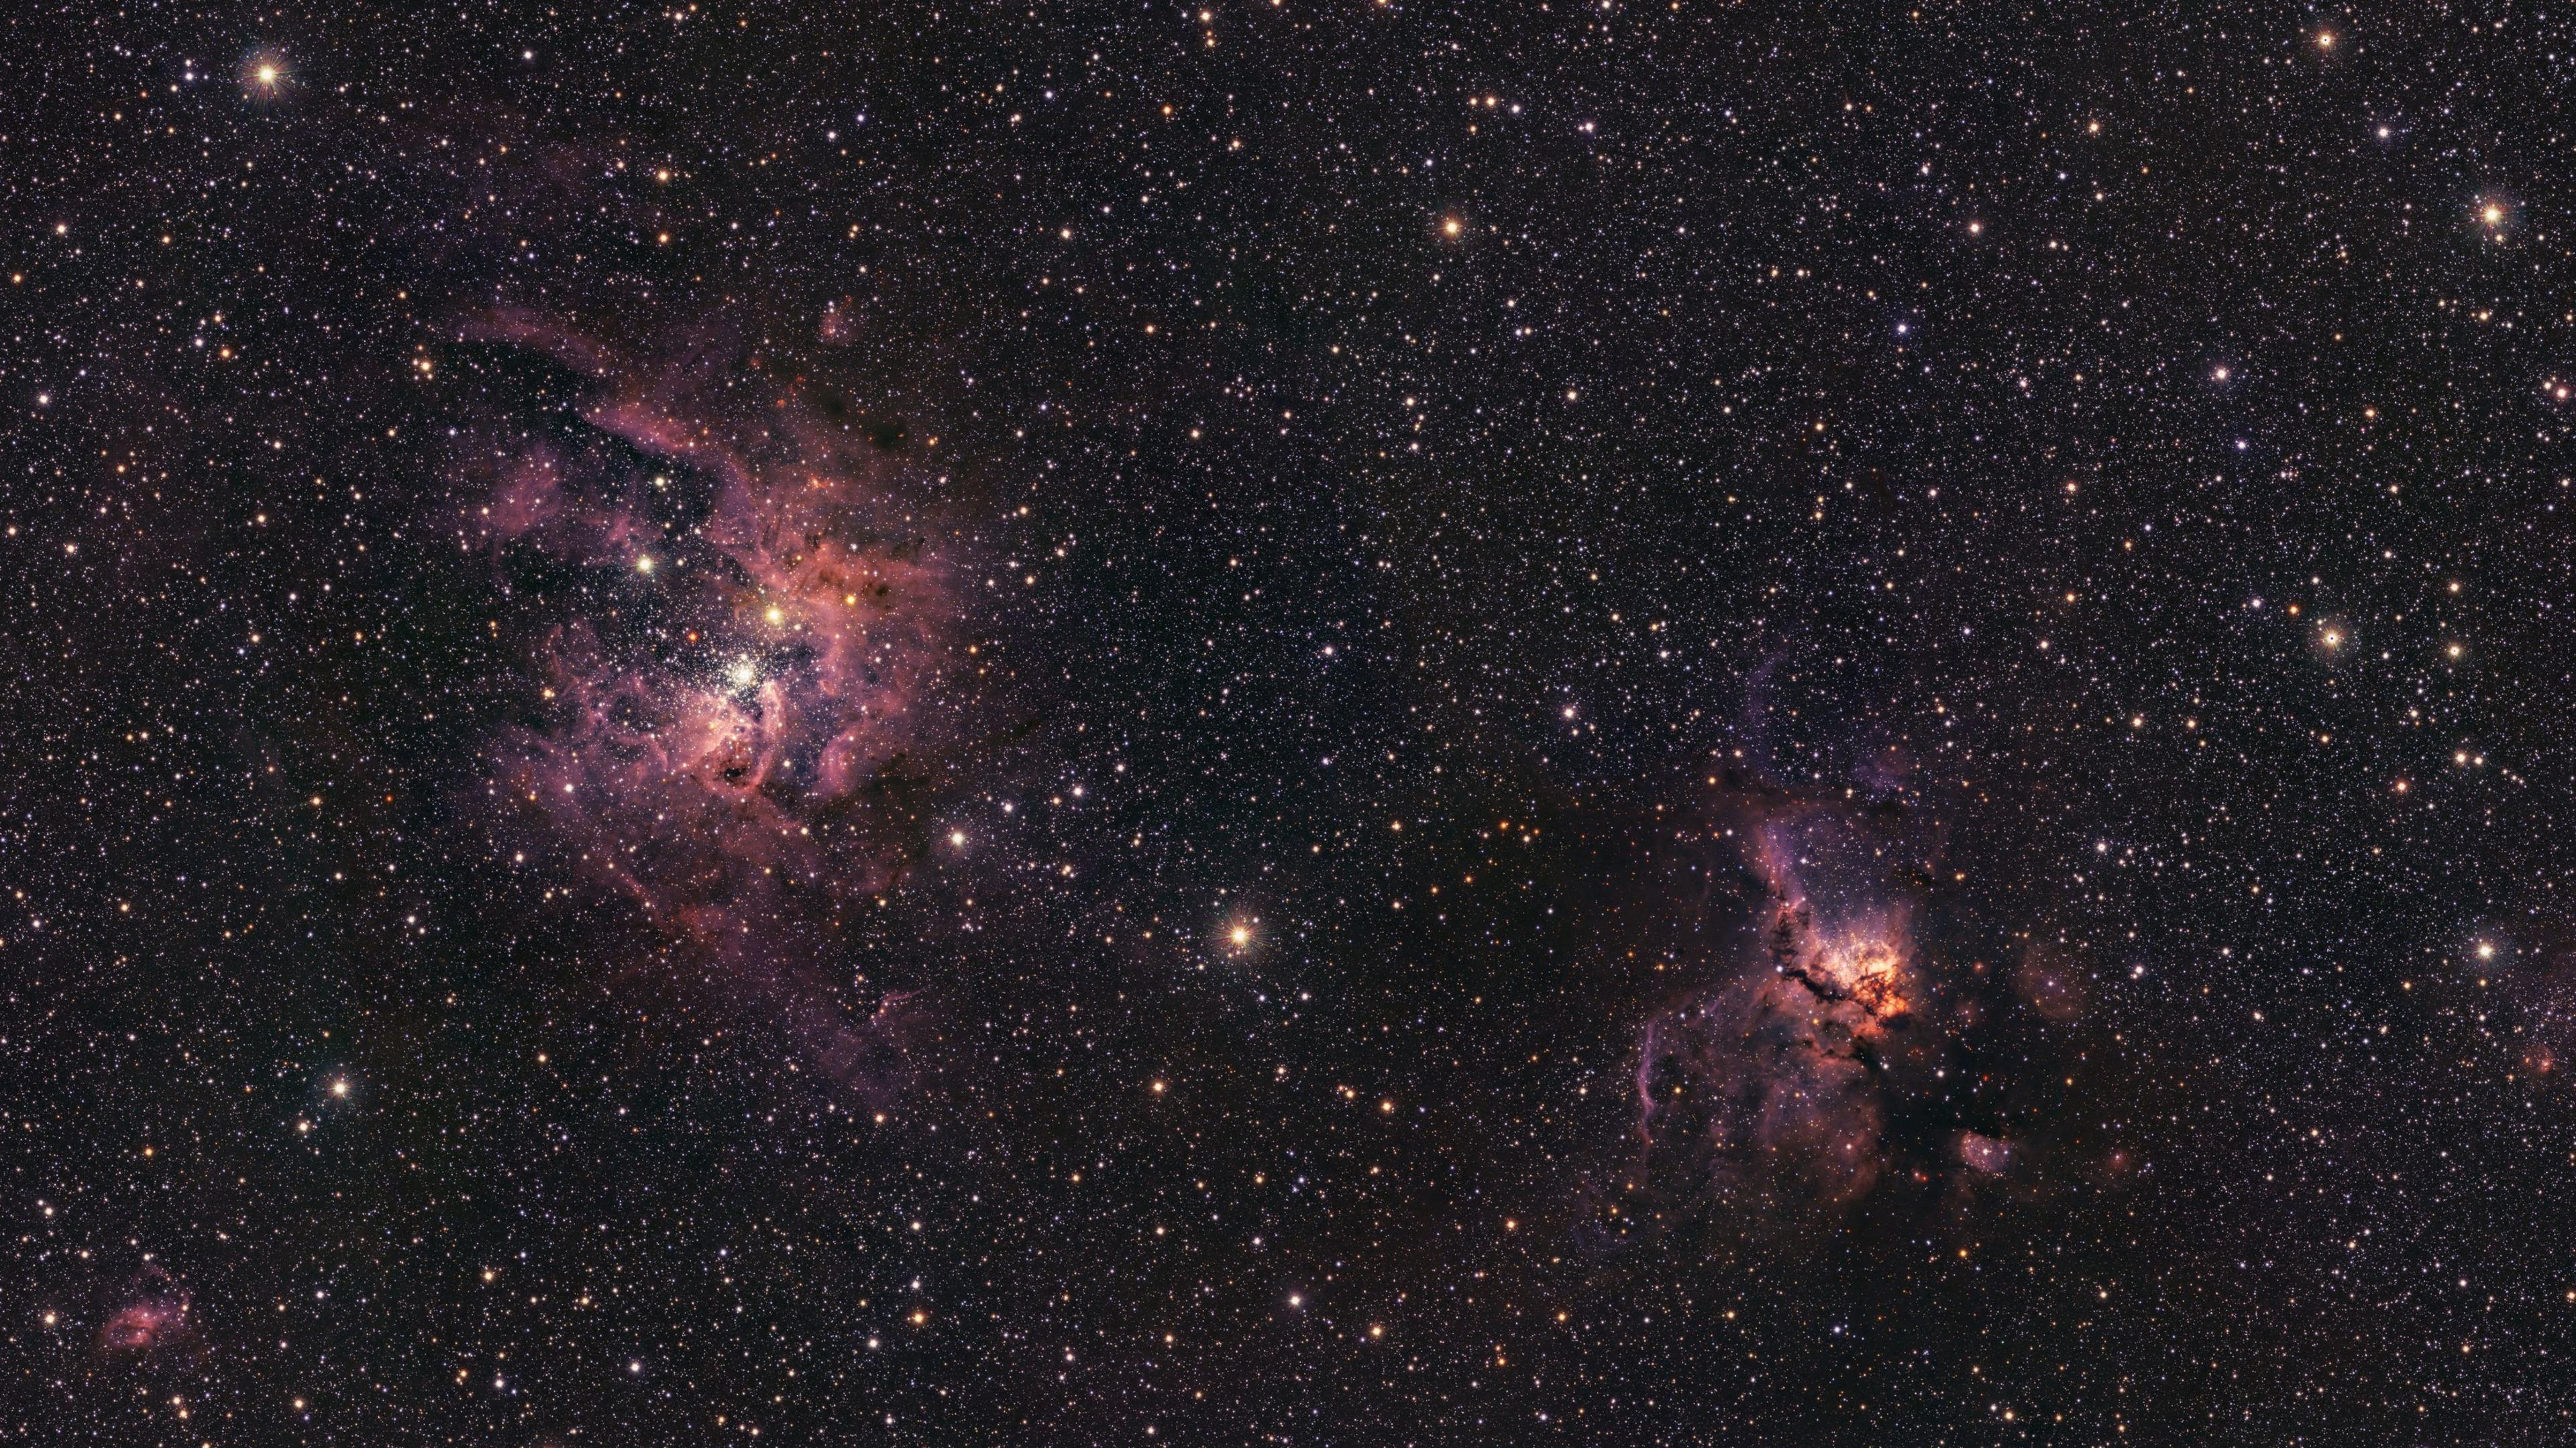
Two nebulas, which are giant clouds of gas and dust, captured with ESO's Visible and Infrared Survey Telescope for Astronomy
What technology has been used to study the Milky Way?
The European Southern Observatory (ESO) used an infrared telescope called Vista based in Chile to monitor the central regions of the Milky Way.
Vista's infrared camera can peer through the dust and gas that's spread throughout our galaxy to identify the Milky Way's most hidden places.
Infrared light is invisible to the human eye, but it is emitted by all objects based on their temperature.
The telescope can detect and then translate this energy into a visual image that we can see.
Observing infrared light allows the telescope to spot very cold objects, such as brown dwarfs - which are failed stars, or free-floating planets that do not orbit a star.
The huge infrared map comes in at 500 terabytes of data, which is the equivalent storage space of more than 600 PS5 game consoles.
The finished map, located at the ESO's Paranal Observatory in Chile is made up of 200,000 images taken by Vista.
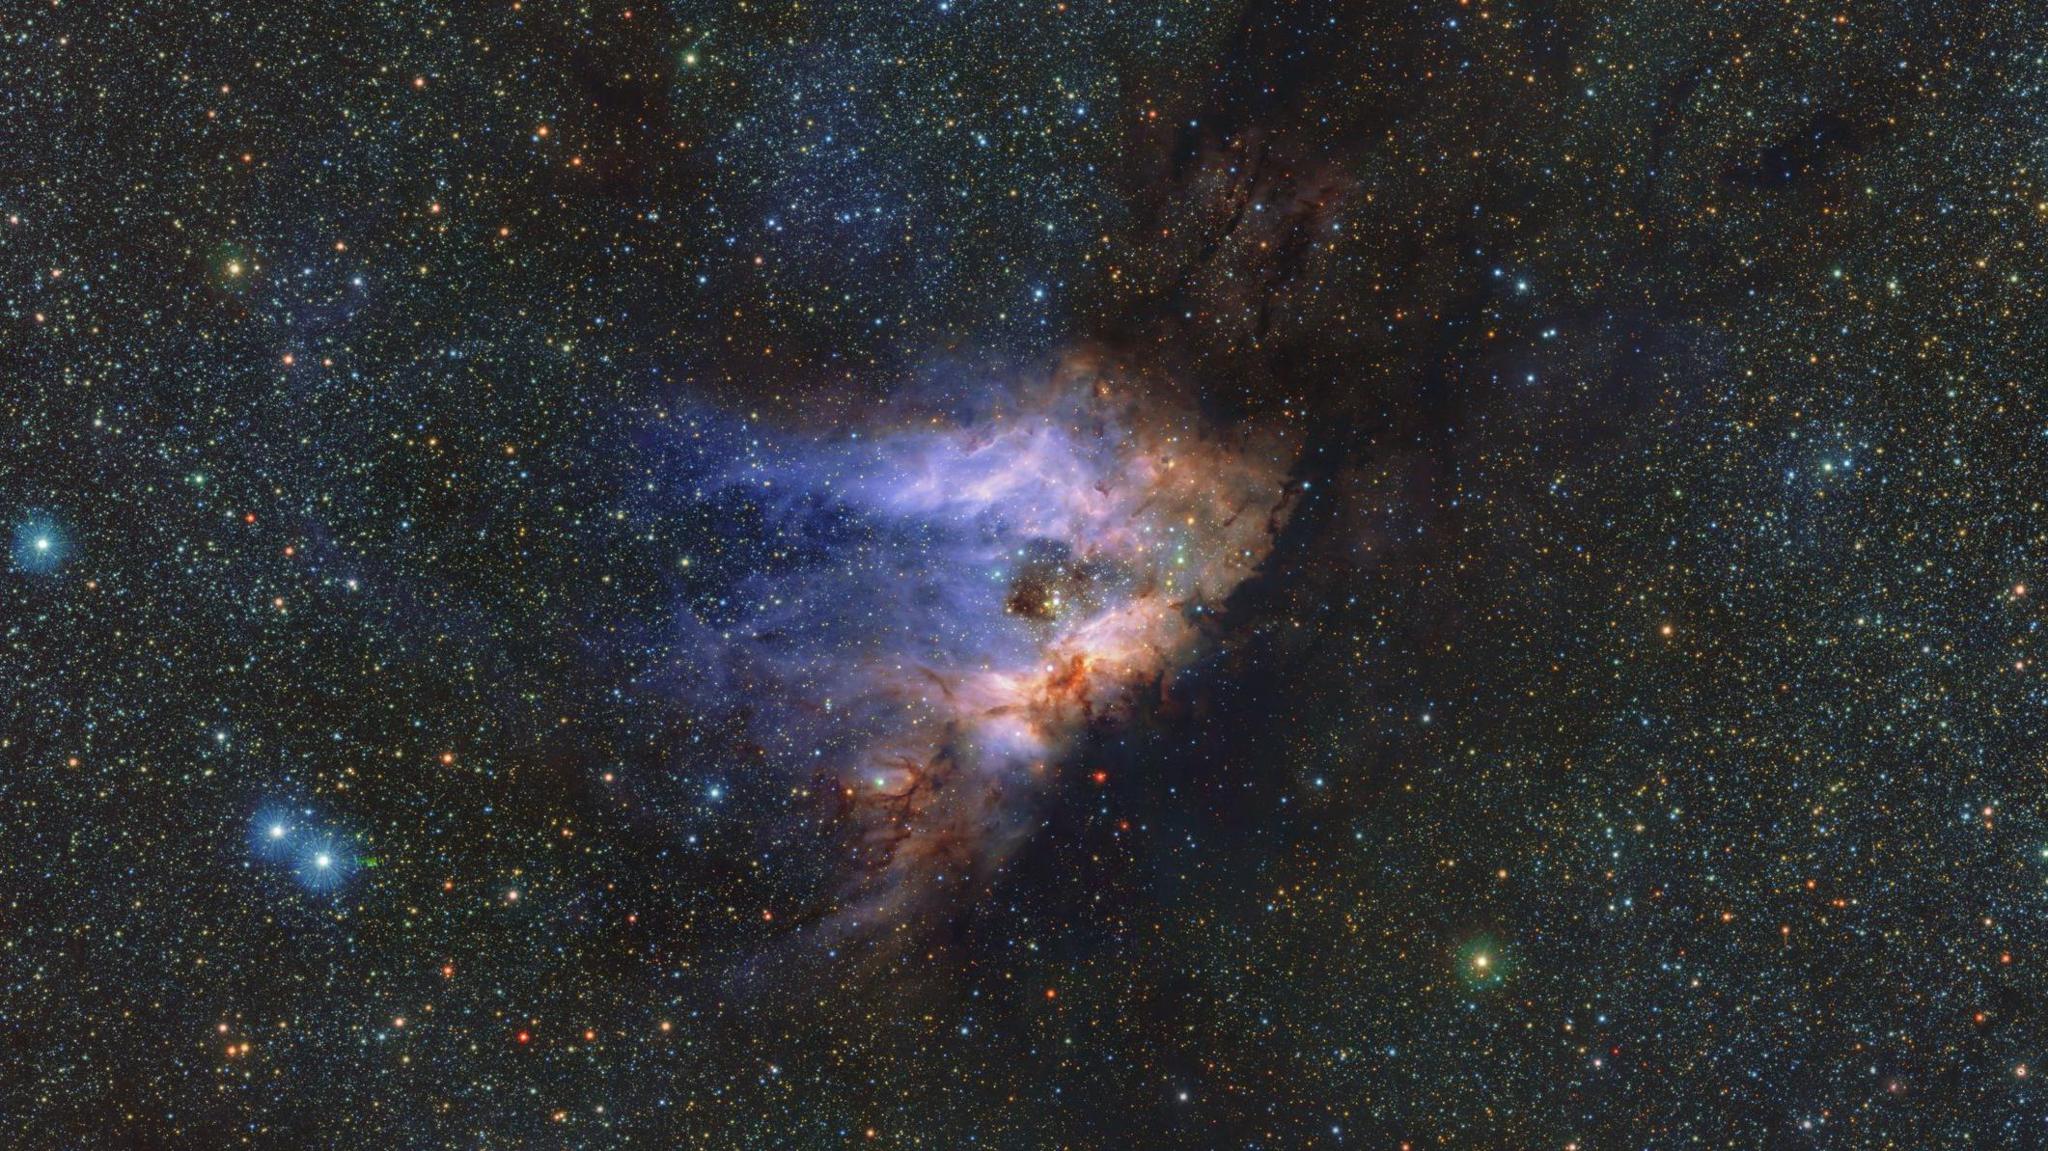
An infrared view of Messier 17, also known as the Omega Nebula or Swan Nebula, which is around 5500 light-years away
How have scientists made the Milky Way map?
By observing each patch of the sky many times, the team was able to determine the locations of these objects, track how they move and whether their brightness changes.
The data covers an area of the sky equivalent to 8,600 full moons, and contains about 10 times more objects than a previous map released by the same team back in 2012.
Dr Oscar Gonzalez, senior project scientist at the UK Astronomy Technology Centre, said: "The completion of the largest infrared map of the Milky Way is a remarkable achievement for the astronomy community.
"The data has provided unprecedented insights into the structure and composition of the Milky Way and will continue to open new avenues for future research that will enhance our understanding of the universe for years to come."
More spectacular space stories
- Published25 September 2024

- Published24 September 2024
- Published17 July 2024
