Premier League: Where did your team finish in 2014?
- Published

Manchester City won the title last season, but were they top dogs in 2014?
What if the Premier League title was decided in a calendar year?
We have calculated the 2014 points totals for each of the teams to have played in the tail end of last season's campaign and this current one.
Find out where your team finished:
Premier League points table for 2014 (the table does not include relegated and promoted clubs) | ||||||
|---|---|---|---|---|---|---|
P | W | D | L | GD | Pts | |
Manchester City | 38 | 27 | 7 | 4 | 56 | 88 |
Chelsea | 38 | 27 | 7 | 4 | 55 | 88 |
Liverpool | 38 | 23 | 7 | 8 | 31 | 76 |
Arsenal | 38 | 20 | 10 | 8 | 19 | 70 |
Manchester United | 38 | 19 | 9 | 10 | 25 | 66 |
Tottenham | 38 | 20 | 6 | 12 | 6 | 66 |
Southampton | 38 | 18 | 8 | 12 | 19 | 62 |
Everton | 38 | 16 | 8 | 14 | 7 | 56 |
West Ham | 38 | 17 | 5 | 16 | 6 | 56 |
Stoke | 38 | 14 | 10 | 14 | 0 | 52 |
Swansea | 38 | 14 | 7 | 17 | 2 | 49 |
Crystal Palace | 38 | 11 | 12 | 15 | -9 | 45 |
Sunderland | 38 | 10 | 14 | 14 | -13 | 44 |
Newcastle | 38 | 12 | 6 | 20 | -27 | 42 |
Aston Villa | 38 | 10 | 9 | 19 | -26 | 39 |
West Brom | 38 | 8 | 12 | 18 | -19 | 36 |
Hull | 38 | 7 | 9 | 22 | -22 | 30 |
As you can see it was neck-and-neck between Manchester City and Chelsea, with City top by one goal on goal difference.
Liverpool are third as a result of their brilliant second half to last season when they collected 48 points - more than any other club, while Manchester United are fifth in the table despite their seventh-placed finish at the end of the 2013-14 season.
At the other end, it is a sorry tale for Steve Bruce's Hull. Their combined total of 30 points is the same amount that Cardiff managed when they finished bottom last season. They have also managed only seven wins this year.
Crystal Palace might be in the relegation zone in the 2014-15 campaign, but in this table they are six points clear of the bottom three due to the magic touch of previous manager Tony Pulis.
Only seven teams of the 17 in the table managed to accrue more points than the Eagles in the second half of the 2013-14 season.
Below, we take a look at some other statistics from the Premier League in 2014 (players from relegated and promoted clubs have not been included):
Goals scored per Premier League game in 2014 | ||
|---|---|---|
Player | Club | Ratio |
Diego Costa | Chelsea | 0.81 |
Sergio Aguero | Man City | 0.78 |
Wayne Rooney | Man United | 0.57 |
Wilfried Bony | Swansea | 0.53 |
Jay Rodriguez | Southampton | 0.50 |
Edin Dzeko | Man City | 0.48 |
Olivier Giroud | Arsenal | 0.48 |
Papiss Cisse | Newcastle | 0.43 |
Kevin Mirallas | Everton | 0.42 |
Touches per Premier League game in 2014 | ||
|---|---|---|
Player | Club | Ratio |
Cesc Fabregas | Chelsea | 107.11 |
Mikel Arteta | Arsenal | 87.08 |
Santi Cazorla | Arsenal | 85.53 |
Bacary Sagna | Arsenal/Man City | 85.21 |
Leighton Baines | Everton | 85.05 |
David Silva | Man City | 84.52 |
Angel Rangel | Swansea | 83.48 |
Gareth Barry | Everton | 80.23 |
Gael Clichy | Man City | 80.04 |
Morgan Schneiderlin | Southampton | 79.88 |
Passes per Premier League game in 2014 | ||
|---|---|---|
Player | Club | Ratio |
Cesc Fabregas | Chelsea | 86.83 |
Mikel Arteta | Arsenal | 74.75 |
David Silva | Man City | 67.55 |
Gareth Barry | Everton | 67.37 |
Michael Carrick | Man United | 67.19 |
Morgan Schneiderlin | Southampton | 66.03 |
Santi Cazorla | Arsenal | 62.58 |
Nemanja Matic | Chelsea | 61.74 |
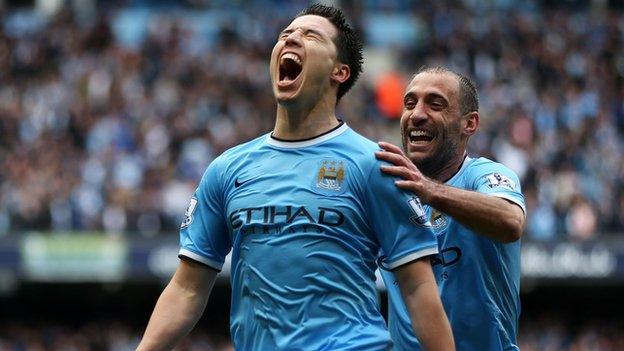
Samir Nasri | Man City | 60.31 |
Steven Gerrard | Liverpool | 59.95 |
Chances created per Premier League game in 2014 | ||
|---|---|---|
Player | Club | Ratio |
Cesc Fabregas | Chelsea | 3.39 |
Samir Nasri | Man City | 2.76 |
Eden Hazard | Chelsea | 2.66 |
Christian Eriksen | Tottenham | 2.62 |
Gylfi Sigurdsson | Swansea | 2.50 |
David Silva | Man City | 2.48 |
Stewart Downing | West Ham | 2.43 |
Santi Cazorla | Arsenal | 2.39 |
Jesus Navas | Man City | 2.32 |
Adam Lallana | Southampton/Liverpool | 2.05 |
- Published11 May 2014
- Published20 June 2016

- Published7 June 2019

- Published2 November 2018