Premier League in 2017: Who tops the table for the year, plus other stats
- Published
- comments

Chelsea and Manchester City have been the dominant teams in the Premier League over the course of the year
Chelsea won the Premier League last season, and Manchester City have started this campaign in blistering fashion, but who tops the table for 2017?
Harry Kane has had a phenomenal year but how many teams did he outscore, and did sacking a manager work?
Delve into those statistics and more in our look back at a record-breaking 2017.
Who tops the 2017 Premier League table?
Chelsea won the title at a canter last season, winning 30 of their 38 games to finish seven points clear of Tottenham.
But, with Antonio Conte's team failing to spark this season, Manchester City have since emerged as the dominant force in England's top flight.
City have won 19 of their 21 league games so far in 2017-18, to add to their 11 victories in the second half of last season. They top the table for 2017.
Premier League table for 2017 | |||||||||
|---|---|---|---|---|---|---|---|---|---|
Position | Club | Matches | W | D | L | Goals for | Goals against | Goal difference | Points |
1 | Man City | 40 | 30 | 8 | 2 | 102 | 30 | +72 | 98 |
2 | Chelsea | 40 | 28 | 5 | 7 | 82 | 34 | +48 | 89 |
3 | Tottenham | 40 | 27 | 6 | 7 | 92 | 33 | +59 | 87 |
4 | Man Utd | 40 | 21 | 14 | 5 | 68 | 26 | +42 | 77 |
5 | Arsenal | 41 | 23 | 7 | 11 | 76 | 51 | +25 | 76 |
6 | Liverpool | 40 | 20 | 14 | 6 | 80 | 45 | +35 | 74 |
7 | Everton | 40 | 17 | 10 | 13 | 62 | 53 | +9 | 61 |
8 | Burnley | 40 | 13 | 12 | 15 | 36 | 43 | -7 | 51 |
9 | Leicester | 40 | 14 | 9 | 17 | 55 | 64 | -9 | 51 |
10 | Swansea | 40 | 13 | 6 | 21 | 37 | 58 | -21 | 45 |
11 | Crystal Palace | 41 | 12 | 8 | 21 | 39 | 62 | -23 | 44 |
12 | Watford | 41 | 12 | 7 | 22 | 48 | 75 | -27 | 43 |
13 | Stoke | 40 | 11 | 10 | 19 | 42 | 70 | -28 | 43 |
14 | Bournemouth | 40 | 10 | 12 | 18 | 49 | 68 | -19 | 42 |
15 | Southampton | 40 | 10 | 12 | 18 | 42 | 56 | -14 | 42 |
16 | West Ham | 39 | 10 | 11 | 18 | 46 | 69 | -23 | 41 |
17 | West Brom | 40 | 7 | 14 | 19 | 33 | 56 | -23 | 35 |
18 | Huddersfield | 21 | 6 | 6 | 9 | 18 | 32 | -14 | 24 |
19 | Brighton | 21 | 5 | 7 | 9 | 15 | 25 | -10 | 22 |
20 | Hull | 19 | 6 | 3 | 10 | 21 | 39 | -18 | 21 |
21 | Newcastle | 21 | 5 | 4 | 12 | 19 | 30 | -11 | 19 |
22 | Middlesbrough | 19 | 1 | 7 | 11 | 10 | 31 | -21 | 10 |
23 | Sunderland | 19 | 2 | 4 | 13 | 12 | 34 | -22 | 10 |
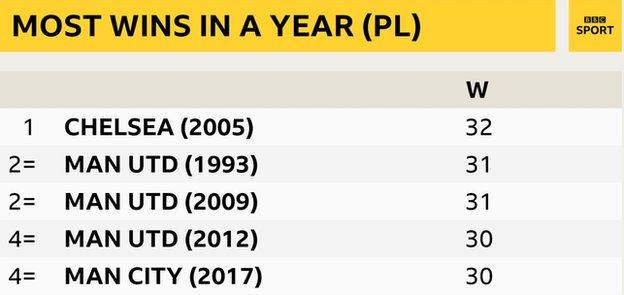
But, despite an incredible 18-match winning run which ended on the final day of year at Crystal Palace, City did not set the record for the most Premier League wins in a calendar year.
They finished 2017 with 30, two fewer than Chelsea managed in 2005. The Londoners were the dominant force in English football at that time, winning the title in 2004-05 and again the following season.
Come back in 12 months' time, though, because City may well be top of the pile then.

What more to say about Harry Kane?

Kane scored 56 goals in 52 games for Tottenham and England in 2017 - the most by a player in one of Europe's top five leagues
One player pretty much guaranteed to feature in most people's team of the year is Harry Kane.
The all-time top Premier League goalscorer in a calendar year, and highest-scoring player for club and country in Europe in 2017, it's been quite a year for the Tottenham striker.
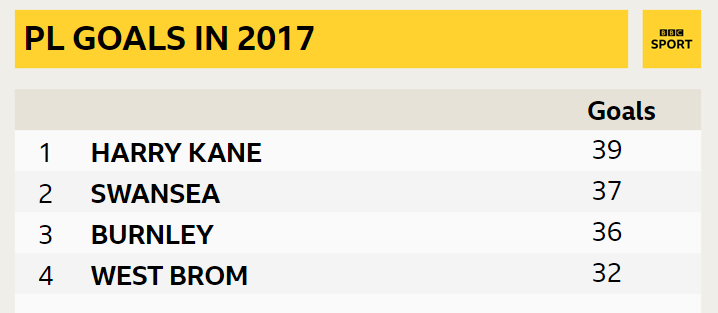
Kane scored 39 league goals in 2017, three more than Alan Shearer managed when he set the Premier League record in 1995. Just imagine where he would be if he could score in August.
Kane was at his most deadly in the final month of last season and the final month of the year, scoring eight goals in May and also in December.
His tally included six Premier League hat-tricks - as many as every other player in the top flight have managed between them this season.
It also takes his tally of top-flight hat-tricks to eight - more than several Premier League teams have managed during their entire stay in the competition.
Kane has also scored more hat-tricks (eight) in all competitions this year than Lionel Messi, Cristiano Ronaldo and Edinson Cavani combined (seven).
And we're not done yet. Kane outscored three Premier League teams in 2017.

So does Kane feature in your team of the year? Select your XI below.
Most points and most goals
Breaking things down month by month, it is no surprise to see Manchester City have taken more points than any other team since October.
What is perhaps surprising, however, is Chelsea never collected the most points in a single month in the second half of last season, despite winning the title.
Month | Most points |
|---|---|
January | Tottenham (11) |
February | Man City (9) |
March | Liverpool & Bournemouth (7) |
April | Tottenham (18) |
May | Arsenal (15) |
August | Man Utd (9) |
September | Man City (12) |
October | Arsenal/Man City (9) |
November | Man City (12) |
December | Man City (18) |
And what about the highest-scoring team and players each month? Not always Manchester City and Kane, with evergreen Brighton striker Glenn Murray among those to feature.
Month | Top scoring team | Top scoring player |
|---|---|---|
January | Tottenham & Arsenal (12) | Dele Alli/Harry Kane (5) |
February | Everton (9) | Romelu Lukaku (5) |
March | Everton (9) | Joshua King/ Lukaku (4) |
April | Tottenham (16) | Son Heung-min/Christian Benteke/Sergio Aguero (5) |
May | Man City & Tottenham (15) | Kane (8) |
August | Man Utd (10) | Lukaku/Sadio Mane (3) |
September | Man City (17) | Kane (6) |
October | Man City (13) | Leroy Sane/Glenn Murray (3) |
November | Liverpool (11) | Mohamed Salah (7) |
December | Liverpool (20) | Kane (8) |
Is Man City's 102 goals a record?
There was a time when barely a week seemed to go by without Manchester City netting four or five in a game, and they finished the year with a stunning 102 goals scored in the Premier League.
That is the most in a calendar year since the competition began in 1993; indeed no team prior to City had managed to break the 100-goal barrier.
Top-scoring Premier League teams by year | ||
|---|---|---|
Year | Team | Goals |
2017 | Man City | 102 |
2016 | Liverpool | 87 |
2015 | Man City | 79 |
2014 | Man City | 89 |
2013 | Liverpool | 84 |
2012 | Man Utd | 90 |
2011 | Man Utd | 88 |
2010 | Chelsea | 91 |
2009 | Arsenal | 86 |
2008 | Chelsea | 74 |
2007 | Man Utd/Tottenham | 73 |
2006 | Man Utd | 79 |
2005 | Chelsea | 75 |
2004 | Arsenal | 86 |
2003 | Man Utd | 79 |
2002 | Arsenal | 80 |
2001 | Man Utd | 79 |
2000 | Man Utd | 95 |
1999 | Man Utd | 91 |
1998 | Liverpool | 68 |
1997 | Man Utd | 83 |
1996 | Man Utd | 75 |
1995 | Man Utd | 75 |
1994 | Newcastle | 84 |
1993 | Man Utd | 86 |
A bad year to be a manager?

Top left to bottom right: Frank de Boer (Crystal Palace), Craig Shakespeare (Leicester), Paul Clement (Swansea), Ronald Koeman (Everton), Tony Pulis (West Brom) and Slaven Bilic (West Ham) have all lost their jobs since the start of the season
It felt like a particularly ruthless first half of the season for Premier League managers, with six leaving their posts before Christmas.
Paul Clement's dismissal by Swansea on 20 December means the bottom four teams at the end of the year have changed their manager this season.
And it is easy to see why Swansea felt a change was necessary - all but one of the other five teams to change their manager are picking up more points per game than they were previously. Alan Pardew, at West Brom, is the exception.
So we know it's been a pretty bad end to the year for some managers, but how about the start?
Five were dismissed before June - Mike Phelan (Hull), Claudio Ranieri (Leicester), Aitor Karanka (Middlesbrough), Walter Mazzarri (Watford) and Claude Puel (Southampton), making it 11 for the year in the Premier League. That's the joint most in the past decade, equal with 2013.
Are English players getting more minutes?

England beat Venezuela in June to win the U20s World Cup
2017 was an incredible year of success for England at youth level.
The Three Lions won the Under-20 World Cup, the Under-19 Euros, the Toulon Tournament and finishing runners up in the Under-17 Euros, all of which bodes well for the future of the senior team.
But England Under-21s boss Aidy Boothroyd said earlier this year that young English players need more game time in the Premier League to boost the senior team's chances of World Cup success.
Are they getting it?
The numbers since England's summer of success suggest they are. English players are averaging more minutes per match than they did in three of the past four seasons.
PL minutes for English players in past five seasons | |||
|---|---|---|---|
Season | Minutes played | Matches | Mins/match |
2013-14 | 242,236 | 380 | 637.46 |
2014-15 | 263,984 | 380 | 694.69 |
2015-16 | 225,462 | 380 | 593.32 |
2016-17 | 242,032 | 380 | 636.93 |
2017-18 | 137,288 | 209 | 656.88 |
- Published24 December 2017

- Published24 December 2017