Premier League: How are teams doing compared with same fixtures last season?
- Published

Against Brighton, Harry Kane scored his 143th goal for Tottenham in all competitions - drawing him level with Jermain Defoe as the joint-fifth top scorer for the club
Tottenham have improved this season, Manchester United have gone backwards.
With six games gone in the Premier League, data analysts Gracenote have assessed every team's start to the campaign - and the findings make for interesting reading.
Chin up Tottenham supporters?
With three straight defeats leading to talk of a "mini-crisis", external at Tottenham and some bizarre comments from manager Mauricio Pochettino, you would be forgiven for thinking Tottenham had endured a poor start to the season.
But a look in detail at their results so far shows they are actually three points better off than they were from the corresponding fixtures last season, as well as having one point more than they did after six matches in 2017-18.
So despite their stadium not being ready yet, questions over Harry Kane's fitness and the worst run of results since Mauricio Pochettino took charge in 2014, perhaps it is time for a little perspective.
Points after six games in 2018-19 | Points after six games in 2017-18 | Points from corresponding fixtures 2017-18 |
|---|---|---|
12 | 11 | 9 |
Manchester United - it's good but is it good enough?

Manchester United have dropped six points from seven Premier League games at Old Trafford against newly promoted opposition under Jose Mourinho - more than the side had dropped in 10 seasons between 2006-07 and 2015-16 (five)
Winless Newcastle aside, Manchester United have endured the biggest drop-off of any Premier League team when it comes to comparing this season's results with 2017-18.
They have steadied the ship in recent weeks with two consecutive away wins, plus one on the road in the Champions League. They are seventh in the league and within touching distance of the top four.
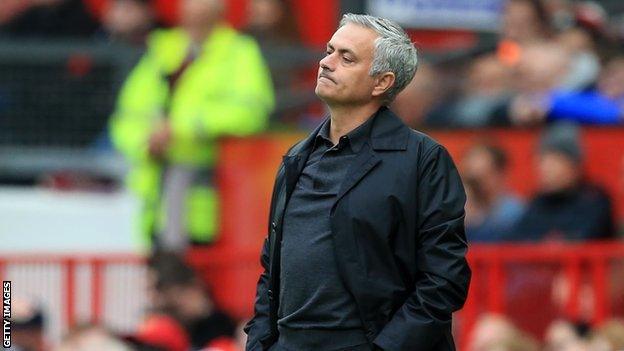
And if you look at manager Jose Mourinho's face you can see a slight upturn in that frown.
But United have taken five fewer points this term than from the same games last season, and they also have six points fewer overall than they did after six matches 12 months ago.
Given that they finished 19 points behind champions Manchester City last season, that downturn might be a little alarming.
Points after six games in 2018-19 | Points after six games in 2017-18 | Points from corresponding fixtures 2017-18 |
|---|---|---|
10 | 16 | 15 |
Man City on course to match record points haul

Since Pep Guardiola took over before the 2016-17 season, Manchester City have scored five or more goals in 10 Premier League fixtures - four times more than any other side
In strolling to the title last season, Manchester City set a record by becoming the first team in English top-flight history to reach 100 points.
It was one of a series of landmarks achieved by Pep Guardola's side, but one that attacker Kevin de Bruyne said would be "probably impossible", external to repeat.
But so far, so good for City, who are on course to replicate last season's tally.
They have 16 points from six games, exactly the same as they had at this stage during the last campaign.
And what about the corresponding fixtures comparison? For the sake of this table we are substituting relegated Swansea for promoted Wolves, which means that City also managed 16 points from those same fixtures last season.
They are the only side in the table to have neither improved nor performed worse. Consistently brilliant.
Points after six games in 2018-19 | Points after six games in 2017-18 | Points from corresponding fixtures 2017-18 |
|---|---|---|
16 | 16 | 16 |
Gunners getting better?

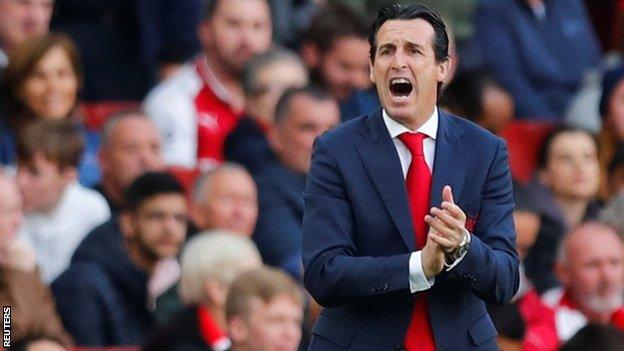
Sunday's 2-0 win against Everton was Arsenal's first clean sheet in their seventh game in all competitions under new boss Unai Emery
Many Arsenal fans were relentlessly vocal in their calls for Arsene Wenger to leave the club last season, so has the change in manager made a difference so far?
It is perhaps too early to judge Emery, but the statistics do indicate the Gunners have improved following Wenger's departure.
Arsenal are two points better off than this time last year and have earned five more points in the corresponding fixtures (Stoke have been replaced by Cardiff for comparison purposes). The Gunners lost at Newcastle and the Potters last season.
Points after six games in 2018-19 | Points after six games in 2017-18 | Points from corresponding fixtures 2017-18 |
|---|---|---|
12 | 10 | 7 |
Big moves by Palace and Liverpool

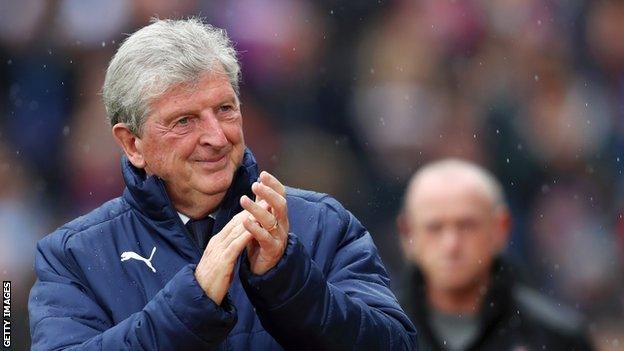
Former England manager Roy Hodgson saved Palace from relegation last season after taking over from Frank de Boer
Chelsea and Watford have made splendid starts and got the better of opponents they struggled against last campaign.
But it is the points improvements of Liverpool and Crystal Palace which are the most striking among the best of the rest.
The Eagles had a shocking start to the 2017-18 season, losing their first seven games and failing to score in 731 minutes.
Fast forward to September 2018 and they sit comfortably in mid-table with seven points, and have earned (more modestly, admittedly) one more point than they gained from last season's six corresponding fixtures.
Points after six games in 2018-19 | Points after six games in 2017-18 | Points from corresponding fixtures 2017-18 |
|---|---|---|
7 | 0 | 6 |
Are Liverpool the team likeliest to challenge champions City for the title? They currently have the league's only 100% record, and are seven points better off than at this stage last season.
Two draws against Watford and Burnley and a heavy defeat at Etihad Stadium meant they trailed City by five points after only six games in 2017-18. It is a very different story this season - but how long can Jurgen Klopp's men maintain this run?
Points after six games in 2018-19 | Points after six games in 2017-18 | Points from corresponding fixtures 2017-18 |
|---|---|---|
18 | 11 | 15 |
The full table
The top 10:
In order of best points improvement relative to corresponding fixtures | Points in corresponding fixtures 2017-18 | Points in corresponding fixtures 2018-19 | Points after six games 2017-18 | Points after six games 2018-19 |
|---|---|---|---|---|
Chelsea | 7 | 16 (+9) | 13 | 16 (+3) |
Watford | 4 | 13 (+9) | 11 | 13 (+2) |
Arsenal | 7 | 12 (+5) | 10 | 12 (+2) |
Wolves | 5 | 9 (+4) | 5 | 9 (+4) |
Liverpool | 15 | 18 (+3) | 11 | 18 (+7) |
Tottenham | 9 | 12 (+3) | 11 | 12 (+1) |
Fulham | 3 | 5 (+2) | 8 | 5 (-3) |
Crystal Palace | 6 | 7 (+1) | 0 | 7 (+7) |
Leicester | 8 | 9 (+1) | 4 | 9 (+5) |
Man City | 16 | 16 (0) | 16 | 16 (0) |
Source: Gracenote | ||||
The bottom 10:
In order of best points improvement relative to corresponding fixtures | Points in corresponding fixtures 2017-18 | Points in corresponding fixtures 2018-19 | Points after six games 2017-18 | Points after six games 2018-19 |
|---|---|---|---|---|
Southampton | 5 | 5 (0) | 8 | 5 (-3) |
Huddersfield | 2 | 2 (0) | 9 | 2 (-7) |
Everton | 8 | 6 (-2) | 7 | 6 (-1) |
Cardiff | 4 | 2 (-2) | 5 | 2 (-3) |
West Ham | 7 | 4 (-3) | 4 | 4 (0) |
Bournemouth | 14 | 10 (-4) | 3 | 10 (+7) |
Brighton | 9 | 5 (-4) | 7 | 5 (-2) |
Burnley | 9 | 4 (-5) | 9 | 4 (-5) |
Man Utd | 15 | 10 (-5) | 16 | 10 (-6) |
Newcastle | 10 | 2 (-8) | 9 | 2 (-7) |
Source: Gracenote | ||||
Note: When comparing promoted teams, Fulham's results have been substituted for West Brom's in 2017-18, Cardiff's for Stoke's and Wolves' for Swansea's.