What the Tokyo medal table tells us halfway through the Games
- Published

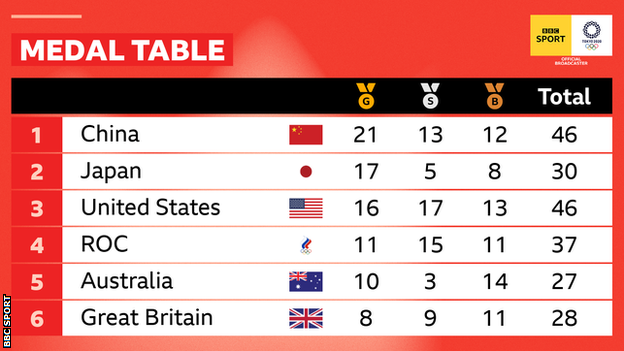
The United States are still expected to top the final medal table, with China second and Japan third. No other country is forecast to get close to those three on gold medals.
The Olympics makes medal table obsessives out of all of us. Who will get the most golds? Where will Team GB finish?
But as the Tokyo Games reaches its halfway stage, there's a few other trends and quirky stats that you might not have spotted.
Simon Gleave, head of sports analysis at data company Nielsen Gracenote, picks out the interesting data:
Hosts with the most
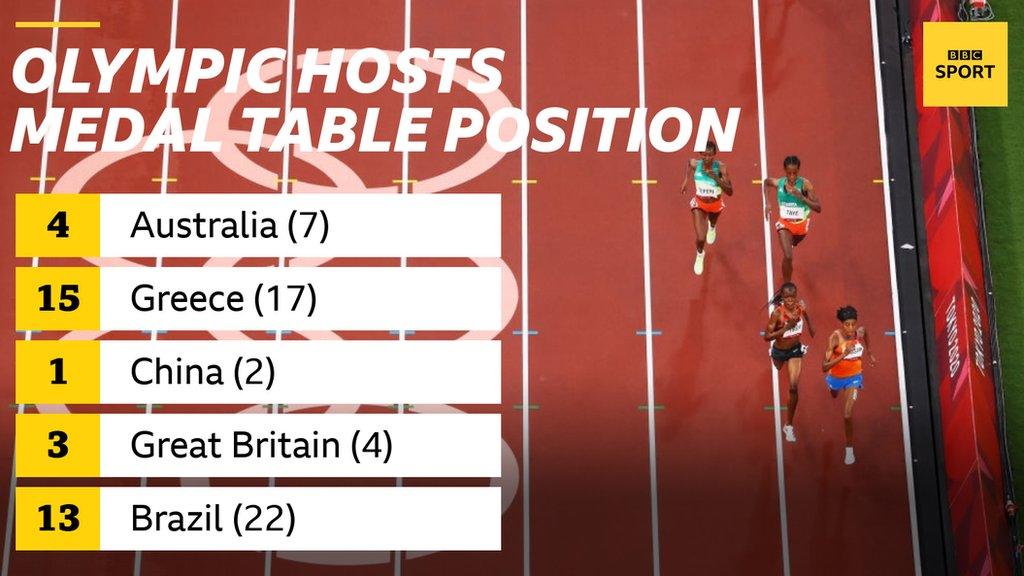
Staging the Games is pretty much guaranteed to improve your medal position.
Current hosts Japan are a case in point - finishing down in 12th at Rio 2016 but now occupying second place, having already won 30 medals, including more gold medals (17) than they have ever done.
Judo has been particularly fruitful for Japan with a record nine gold medals in the bag. No other country has ever won more than three judo golds at a single Olympics.
Gracenote predicted Japan would win 60 medals by the end of the Games, a 46% improvement on the 41 from Rio 2016, and they look like meeting those expectations.

Number on the left shows where the host nations ranked in the medal table compared to the previous Games
The (not-so) fantastic fourths
Fourth place is often recognised as the "worst position to finish" with the tiniest of margins enough to separate ecstasy and heartache.
At Rio 2016, Team GB finished fourth on 16 occasions, involuntarily 'beating' their post-war record of 15 set at Seoul 1988.
And GB are at it again - in the first eight days of medal events in Tokyo, they are second in the unofficial 'fourth place table' with 12, surpassed only by the United States with 13.
This is one table Team GB won't want to finish top of...
Fourth place table at the Tokyo Games | |
|---|---|
Team | Number of fourth places |
United States | 16 |
Great Britain | 12 |
Italy | 9 |
Canada | 8 |
France | 7 |
Russian Olympic Committee | 7 |
Netherlands | 6 |
China | 5 |
Source: Nielsen Gracenote | |
Russia, but not as we know it
They might have no anthem, flag or proper name because of doping sanctions that mean they are having to compete as the Russian Olympic Committee team, but the medals are racking up for 'Russia' and their rivals aren't happy about it.
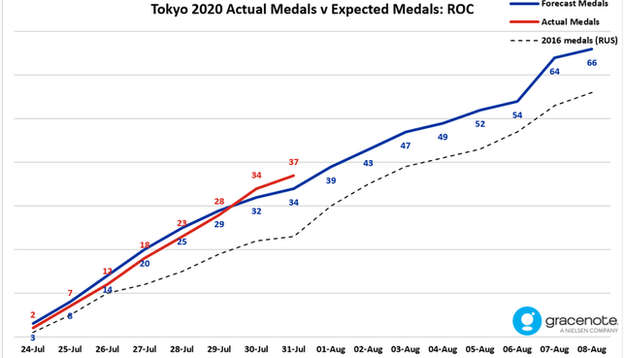
Before the Games Gracenote predicted the ROC would win 66 medals including 21 gold in Tokyo. This would have been a comparable performance to Russia's at the 2012 Games, and 10 medals more than Russia won five years ago in Rio.
But while they are currently outperforming their total medal prediction - 37 medals vs 34 predicted - they have actually won two fewer golds than expected at this stage.
With that number of gold medals, ROC and Great Britain will probably be fighting it out for fourth place on the medal table, behind the United States, China and host nation Japan.

ROC are currently outperforming their predicted medal total and that of Russia in 2016
The women's medal table
While all 12 of Canada's medals have been won by women, only 36% of Team GB's haul has come from female competitors.
So far, 230 medals have been won by women (72 gold, 72 silver and 86 bronze) - 47% of the total medal haul of 491.
China lead the way in gold medals won by women with 11, followed by the United States with nine and Australia and Japan with eight apiece, although the US have the most overall with 28, 61% of their entire medal tally.
Great Britain, however, are 12th in the standings with one gold, three silver and six bronze in women's events.
The women's medal table at Tokyo 2020 | |||||
|---|---|---|---|---|---|
Country | Gold | Silver | Bronze | Total | % of total medals |
China | 11 | 4 | 6 | 21 | 46% |
United States | 9 | 11 | 8 | 28 | 61% |
Australia | 8 | 1 | 6 | 15 | 56% |
Japan | 8 | 1 | 5 | 14 | 47% |
ROC | 6 | 10 | 4 | 20 | 51% |
Canada | 3 | 4 | 5 | 12 | 100% |
Switzerland | 3 | 2 | 2 | 7 | 70% |
New Zealand | 3 | 2 | 0 | 5 | 50% |
South Korea | 2 | 3 | 1 | 6 | 38% |
Kosovo | 2 | 0 | 0 | 0 | 100% |
Source: Nielsen Gracenote | |||||
Australia v GB - the 'Olympic Ashes'
When Australia hosted the Sydney Olympics 21 years ago, there was clear water in the medal table between the Aussies and their old sporting rivals, the Brits.
For two consecutive Games in 2000 and 2004, the gap was six places before GB began the turnaround that secured a top-four position at three successive editions.
At Tokyo, the positions - so far - have been reversed.
Year | Australia | Great Britain |
|---|---|---|
2000 - Sydney | 4th | 10th |
2004 - Athens | 4th | 10th |
2008 - Beijing | 6th | 4th |
2012 - London | 8th | 3rd |
2016 - Rio | 10th | 2nd |
2020 - Tokyo (so far) | 5th | 6th |
Source: Nielsen Gracenote | ||
Australia clinched at least 40 medals at four successive Games between 1996 and 2008, only to drop to 35 in 2012 before dipping once more, to 29, in Rio.
Their tumble down the medal charts was partially due to underwhelming performances in the pool. After winning 20 swimming medals at Beijing, they accrued 10 apiece at the last two Games.
But the Aussies have rediscovered their golden touch at the Tokyo Aquatics Centre with 18 medals - seven of which are gold - with five events to go, bettered only by the United States who have ruled the pool with 26 medals (eight gold, nine silver, nine bronze).
Only Melbourne 1956 has produced more golds for their swimming team.
But while Australia is ahead of Great Britain in the medal table at the moment because of their two extra gold medals, that is likely to change before the end of the competition.
According to Gracenote's virtual medal table, Britain are currently forecast to win a total of 16 golds, whereas Australia are only forecast 13. In terms of total medals, the British team is likely to end the Olympics about 20-25 medals ahead of their Australian rivals.