The UK productivity puzzle (cont'd)
- Published
- comments

How can the UK boost its productivity?
We found out this week that British workers, on average, were 20% less productive than the G7 average in 2011, and nearly 40% less productive than the average US worker.
That's the biggest gap since they started measuring it, in 1990.
We shouldn't be surprised by this number - and perhaps we shouldn't be too depressed by it, either (see below). But if we're entering a slightly calmer period for the UK economy, it is going to be very important for policy makers to work out what is driving this shortfall.
Ben Broadbent, from the Bank of England's Monetary Policy Committee, has a good go at this in his latest speech., external
First, a bit of explanation. All that those productivity numbers are really telling us is that Britain has been better at creating jobs over the past five years than at raising national output.
If we're making less stuff, but employing more people to do it, our productivity - output per head - has to have gone down. It's a simple matter of arithmetic.
'Jobs-free growth'
Of course, we'd rather that jobs, productivity and output were all going up, as they usually do. But if you're stuck, as we have been, with the slowest economic recovery in modern memory, most people would probably say it was better for the long-term health of the country to have more people working, less productively, than to have rising productivity but also higher unemployment.
In effect, that is what you have had in the US, where output per worker has jumped by five percentage points since 2007, at the same time as national output (GDP) has risen by only one percentage point. That has only been possible because the number of people in work has fallen by four percentage points in that time, the number of hours worked has fallen even more.
By contrast, British GDP fell 2.4 percentage points between 2007 and 2011, while employment actually rose, by 0.3%. Amazingly, the UK created almost as many jobs as the US did in the three months to July, even though America's economy is seven times larger.
I suspect many Americans would be happy to swap their higher productivity for a few more jobs.
On the campaign trail both the main US presidential candidates are under pressure to say how they would create more employment. As far as I know, President Obama does NOT go round telling voters that high unemployment is a "small price to pay" for a historic rise in productivity.
But, even if we prefer "growth-free jobs" to the other available alternatives, it's important for the Bank of England to understand why employment has grown recently, while output has not.
Why? Because, in the end, we can only get richer - raise our national income per head - if we can create more economic value with the same number of workers. That, too, is a matter of basic arithmetic.
It matters, therefore, whether this is a short-term blip - due to labour-hoarding by employers, for example, coupled with a shortage of demand - or whether something more fundamental has been happening to the "supply side" of our economy, which is systematically preventing us from growing out of the crisis as quickly as we had hoped.
I went through some of the possible explanations in a blog last month. But Ben Broadbent thinks it is increasingly hard to put it all down to a shortage of demand. Something bad must also have happened to our productive potential.
This gets some support, as it happens, from the new figures on international productivity levels, external which I cited at the start.
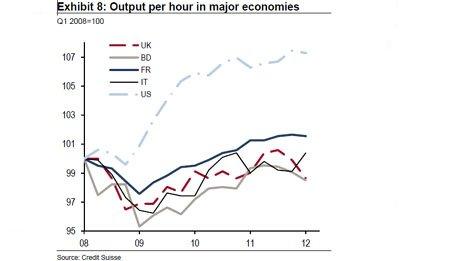
When you measure productivity in terms of output per hour worked, instead of output per worker, these ONS numbers show that our productivity growth has not been very different from other European countries. Even though countries like France and Germany have had stronger recoveries than us and a different set of government policies. (See chart below from Credit Suisse).

So - whatever has been hurting Britain's productivity, it seems to have hit the likes of France and Germany as well. Put it another way, they have had "surprising" growth in employment as well. (Though the output per worker comparison shows you they haven't had quite the puzzle that we have had.)
What might that shock be? Ben Broadbent's explanation is worth reading in full. But in essence he thinks that you can explain quite a lot of what has happened if you assume (a) that some parts of the economy have been much worse affected by the crisis than others, and (b) our damaged financial system has not been doing a good job of pulling capital out of the poorly performing sectors and channelling it to the growing ones.
Put those two together, you get companies in the fast-growing sectors taking on workers to meet rising demand, because they can't get a loan from the bank, and companies in the hard-hit companies holding on to workers, hoping something will turn up. Employment goes up, even if overall output is flat.
In more normal times, the slow-growth companies might go bust - and produce a lot of job losses in the process. But in an environment of super-low interest rates, it's possible that a lot of them have been able to stagger on, and some lenders, at least, have been unwilling to pull the plug.
In its Financial Stability Report last December, the Financial Services Authority reported that a third of commercial property loans were in "forbearance".
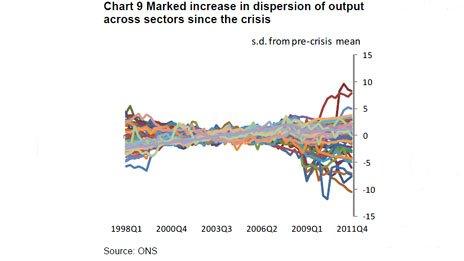
How does this explanation fit the facts? The debate will run and run. But Mr Broadbent pulls together some striking evidence in support, including this wild and wacky chart (below) which looks like an electrical experiment gone wrong, but actually shows the movement of output across 81 sectors of the economy since the late 1990s. Each of the coloured lines represents the output of one sector.

What this chart shows is that the various parts of the economy grew at broadly similar rates for most of the first years of the 21st Century, but since the start of the crisis they've sharply diverged. Some parts of the economy really are doing a LOT better than others.
He also points out that the rate of both corporate failures and start-ups has remained relatively low - far lower, for example, than in the late 1980s or early 1990s. That also backs up the idea that new companies are being held back by a lack of finance while quite a lot of failing companies are somehow surviving, despite very weak demand.
The fact that there is a lot more variation than usual in the rate of return you can earn investing in different parts of the economy also backs up his case. With a well-functioning financial system, you would expect those differences to get ironed out, because people would be getting out of the low-return sectors to invest in the more lucrative ones.
Employment focus
So far, so interesting. If Mr Broadbent's story is true, what does it mean for the future?
Eventually, he thinks things will have to get back to normal, and productivity will start to grow at a decent rate again. If that comes mainly from the high-growth sectors finally getting capital, employment could carry on growing, or at least remain stable.
But if it's from money finally being sucked out of the weak sectors, that's going to show up in lost jobs and even slower economic growth. In that case, the Bank might need to unleash yet another round of quantitative easing.
Whatever happens, Mr Broadbent thinks the Bank of England's Monetary Policy Committee should focus more on employment, which does have a reliable link to inflation, and a bit less on short-term changes in GDP.
That sounds sensible. Politically attractive, even. But politicians might not like the practical consequences.
In effect, Mr Broadbent is suggesting that the MPC should tighten policy if employment growth continues to be strong, in order to meet the inflation target - even if the pace of the recovery is still weak.