Lockdown rules: Michael Gove's Covid claims fact-checked
- Published

The government has been setting out its case for tougher coronavirus measures. Cabinet Office Minister Michael Gove has said England's second national lockdown was brought in to stop the health service being "physically overwhelmed".
The lockdown - which started on 5 November - is due to be replaced tomorrow by a stricter tier system.
Mr Gove was asked on BBC Radio 4's Today programme for the evidence behind the government's decisions.
He made a number of claims:
'Average bed capacity in NHS hospitals in England over the weekend of 15 November was 88%'
He's pretty much right. We make average bed occupancy in England over that weekend 87%, but on average - between 1 November and 22 November - it was about 88%.
Bed occupancy can be used to measure pressure on the health service, and hospitals are meant to try to keep occupancy rates below 85% to have some wriggle-room in case of a surge in patients.
But in previous winters it has often exceeded this. For example, on average over the past four years, the first week in December (we don't have comparable November data) has an occupancy rate of 95%.
This appears to show that hospitals are under less pressure than usual.
However, this is a very different year, says Helen Buckingham, director of strategy at the Nuffield Trust.
"The hospitals have significant constraints in how they can use their beds compared to previous years in relation to infection control and Covid. The measures they have to put in place mean they cannot use all the capacity they've got."
For example, NHS Providers points out that hospitals are arranged differently this year, effectively split into three zones: beds for those with coronavirus, those awaiting test results and those who are negative.
And issues such as increased infection control - including cleaning and putting on personal protective equipment (PPE) - will take up more staffing time, reducing the number of beds that may be used.

"Another thing that's different this year is the availability of staff. We tend to think of beds as a piece a furniture, but a bed is no use to people unless you can staff it," says Ms Buckingham.
Staff absences due to illness or self-isolation will have an impact. During the last peak in April, absence rates hit 6.2% compared with 4% in the previous year.
So lower bed occupancy does not necessarily mean that demand or pressures are lower. NHS Providers says these pressures are currently more similar to a normal year than the figures suggest.
Finally, some of this lower bed occupancy is by design.
Surges in cases can happen very quickly. It took just a month for the number of people in hospitals with coronavirus to triple between October and November.
'At that stage, we had a situation where the R rate, the infection rate, in every part of the country was above one'
Mr Gove pointed to the R number when England entered its second lockdown on 5 November as evidence of the need for tighter restrictions.
The R number refers to the rate of reproduction of the virus. An R rate of one means that each infected person is passing it onto one other person.
Mr Gove was correct. Analysis from the government's Scientific Advisory Group for Emergencies (Sage), which was published on 6 November, external but relied upon data up to 3 November, estimated the R rate was between 1.1 and 1.3 in England.
In the North West, the range of R was between 1.0 and 1.2. This was probably because Liverpool and Manchester had entered tier three by that point and had been under enhanced restrictions for months.
Mr Gove also claimed in the interview with the Today programme that "as a result of the steps that we took, we were able to bring the R rate down and it's now below 1 across the country".

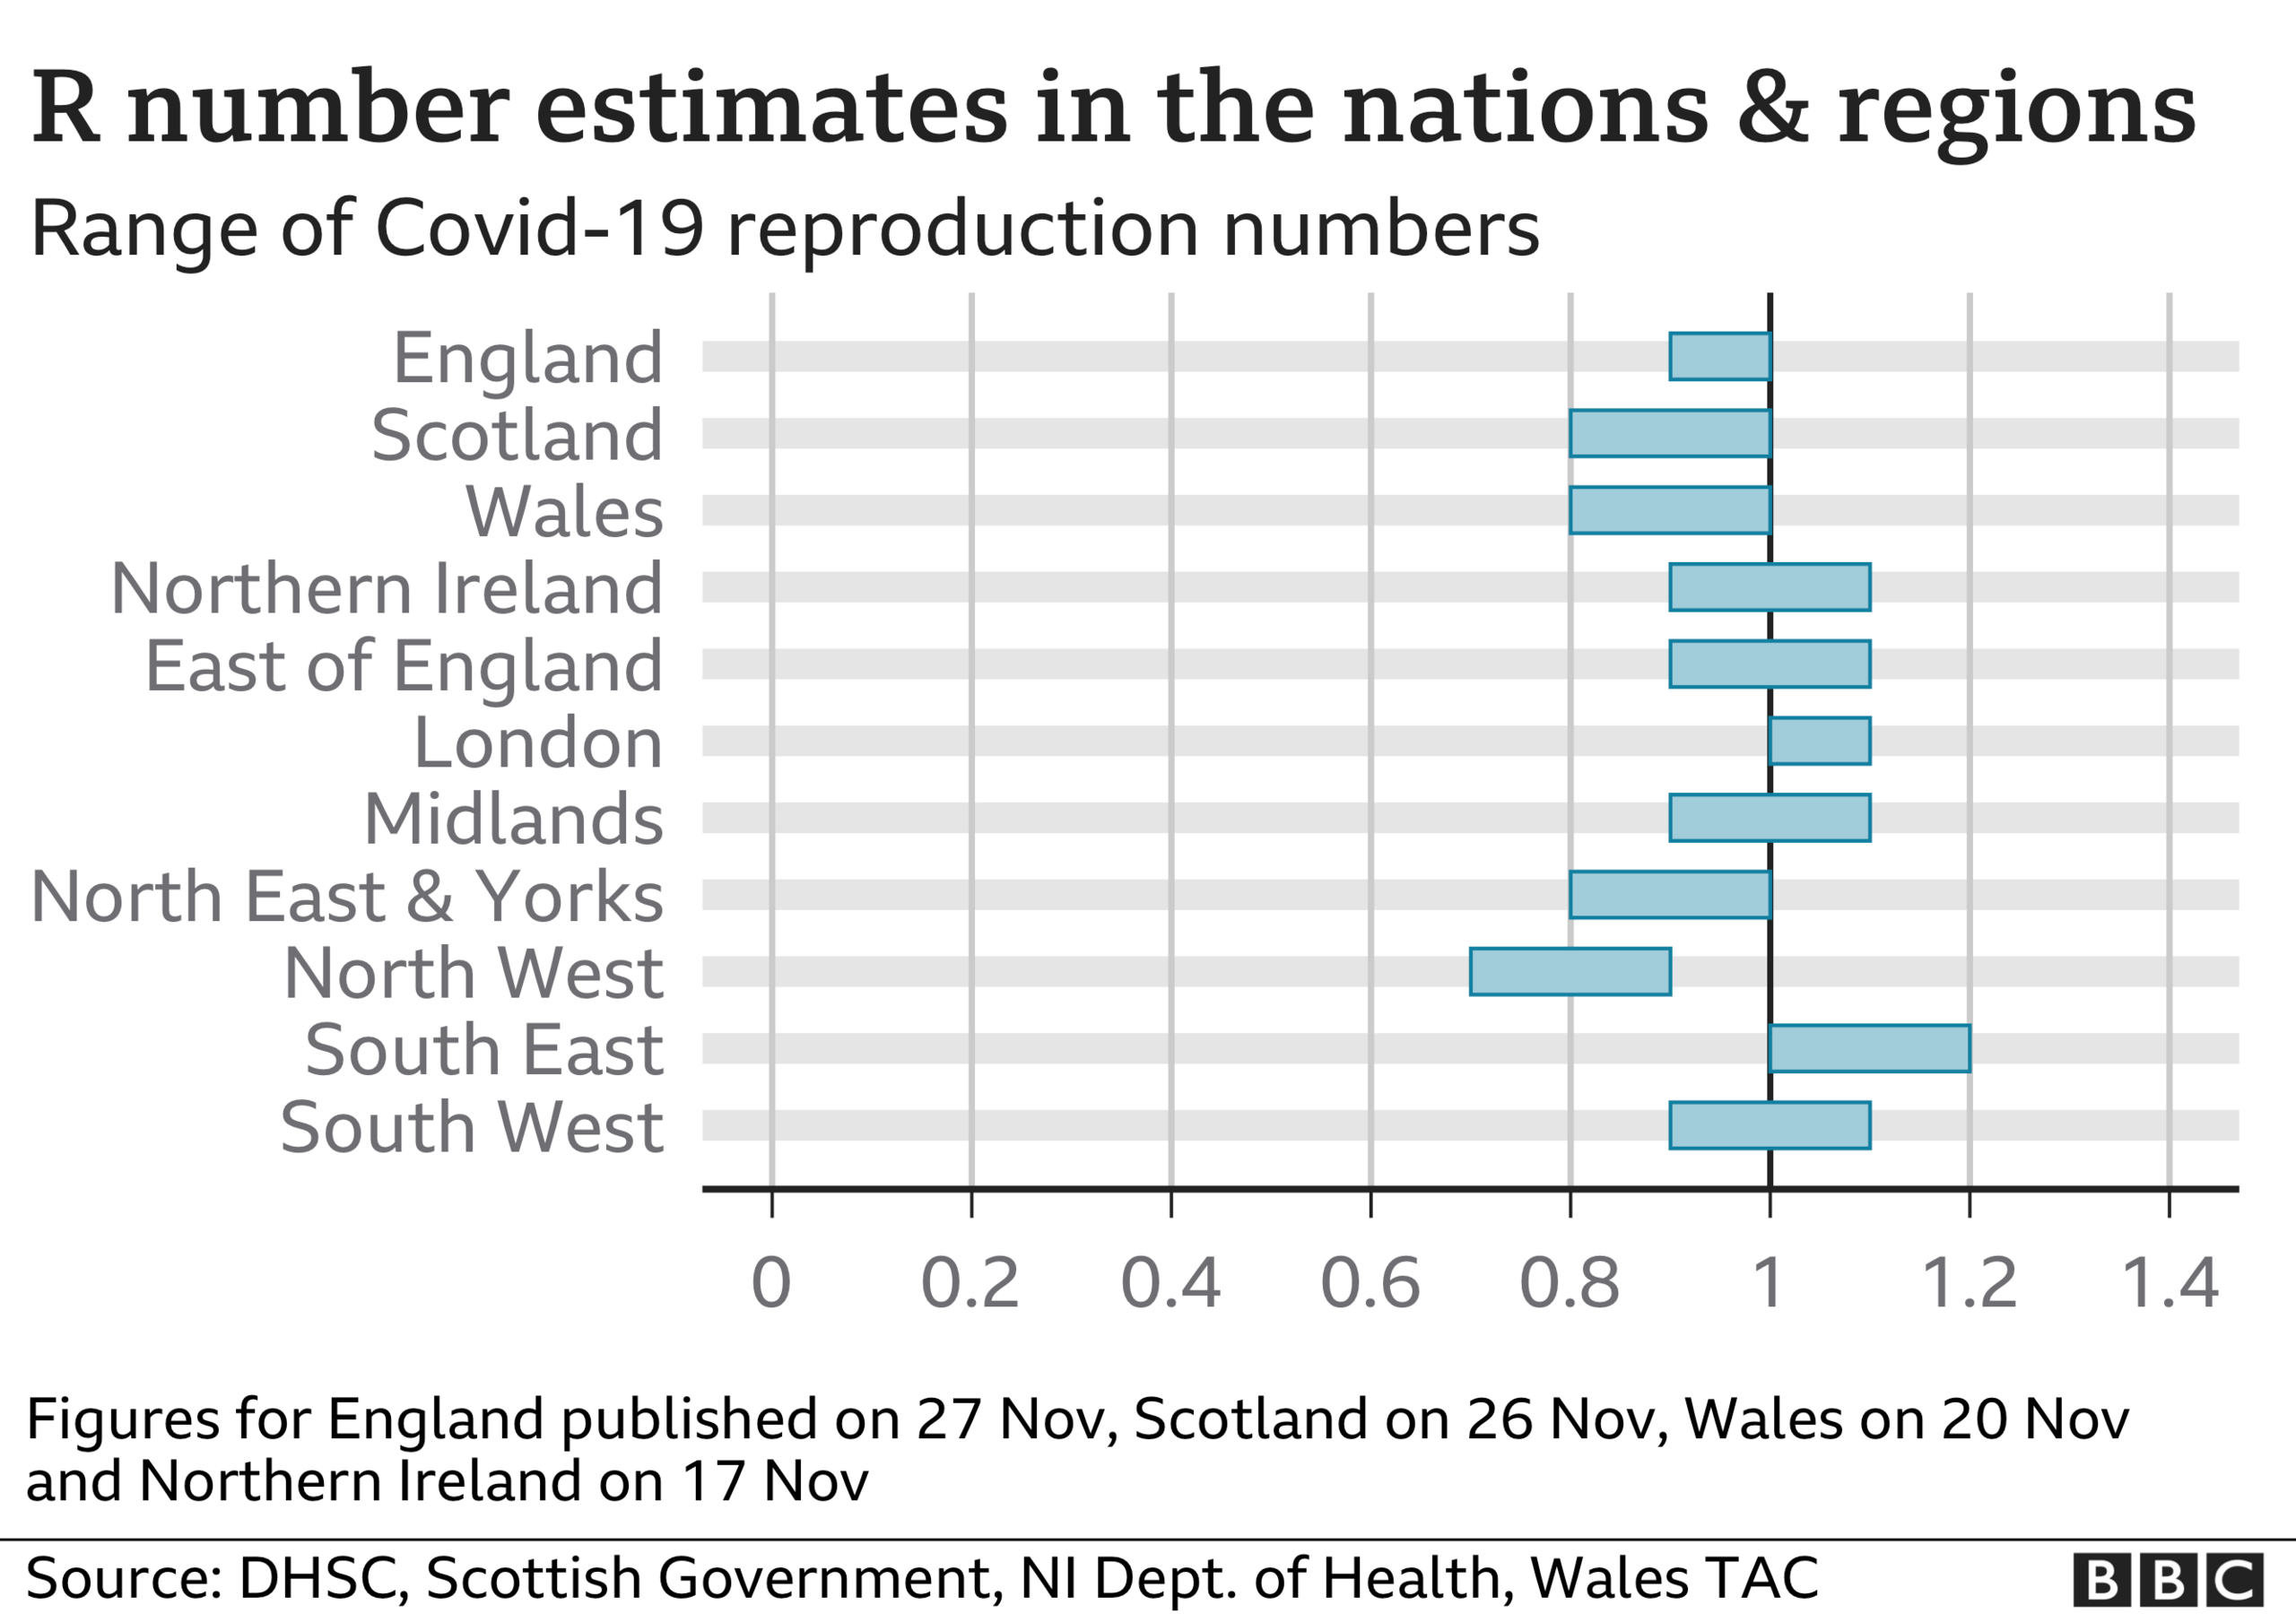
According to data up to 24 November gathered by Sage, the R number in England has now fallen to between 0.9 and 1.0.
However, in five out of the seven regions in England, the upper limit of the range remains above 1.
'The ONS figures showed that the infection was doubling, on average, every 15 days in the six weeks up to the announcement of the November measures'
The relevant ONS data is its infection survey, external, which is published weekly.
This doesn't normally include growth rates but the ONS published a special dataset, external on 31 October that did include these.
The special dataset shows the infection doubling time for the six-week period 12 Sept to 23 October, so not quite the "six weeks before the announcement" claimed (the lockdown was announced on 31 October).
The average over the six-week period was indeed that infections doubled in 15 days.

'We also saw that doubling times in lower-prevalence areas like the East of England and the West Midlands were as low as 12 days over the period'
The regional figures show that the West Midlands and East Midlands, not the East of England as Mr Gove claimed, had a doubling rate of 12 days over this period.
However, neither the West Midlands nor the East Midlands are low-prevalence areas in terms of their infection rates.
The main infection survey report, external published at the same time shows infection rates in the East of England, South West and South East as less than half that of the two Midlands regions.

A SIMPLE GUIDE: How do I protect myself?
AVOIDING CONTACT: The rules on self-isolation and exercise
WHAT WE DON'T KNOW How to understand the death toll
TESTING: Can I get tested for coronavirus?
LOOK-UP TOOL: Check cases in your area


