Four takeaways from 2024's GCSE results

- Published
The students opening GCSE and other Level 2 results earlier had not heard the word "Covid" when they first walked through their secondary-school gates.
Most will have started Year 7 in September 2019, spending a few months getting to grips and making friends before, in the spring, most pupils had to learn from home.
The length of time spent in online lessons over the following two years varied according to where they lived - and looked very different depending on access to laptops and other technology.
These students are unique - the first to have spent every secondary year in the midst, or the wake, of the pandemic.
In Wales and Northern Ireland, they are also the first to experience a return to pre-pandemic grading.
Here are some key things you need to know.
1. GCSE grades have fallen again
The GCSE pass rate across England, Wales and Northern Ireland has fallen for a third year running.
With 67.6% of all grades at 4/C or above, down from 68.2% last year, that overall pass rate has now returned to 2019 levels - the last year exams were sat before Covid.
And it is far below that of 2020 and 2021, when exams were cancelled and results based on teachers’ assessments.

2. The drop is steepest in Northern Ireland
This year, the proportion of GCSEs marked at 4/C or above is:
67.4% in England, down from 67.8% in 2023
61.7% in Wales, down from 64.5%
82% in Northern Ireland, down from 86.6%
Some students in Wales and Northern Ireland – where the drop is steeper than in England - may feel disappointed but the story here is bigger than one of individual performance.
There has been an effort to bring grades back down in line with pre-pandemic levels ever since those sharp rises in 2020 and 2021.
In England, the exams regulator aimed for that return to 2019 levels last year - although the grades remained slightly higher - and this year, the pass rate is around the same.
But in Wales and Northern Ireland, the plan was for this year to be the one when grades fell back in line with pre-Covid levels.
'I got no GCSEs and cleaned pubs - now I'm a uni lecturer'
- Published22 August 2024
How can I help my kids through exam results day?
- Published22 August 2024
3. The regional divide is still growing in England
London remains the highest-performing region this year, with 72.5% of entries marked at 4/C or above, and the West Midlands, where that pass rate was 63.1%, the lowest .
But that 9.4 percentage-point gap is up from 8.7 last year and 6.8 in 2019, when London was again the highest-performing and the West Midlands and the North East the joint lowest.
More broadly, the North-South divide that existed before Covid persists.
Four out of five regions in the North and Midlands had a lower pass rate this year than in 2019 - but in every region in the South it has risen.
The Northern Powerhouse think tank says the regional variations are "largely a reflection of the differences... in the proportions of long-term disadvantaged children by region".
Pupils experienced different amounts of Covid disruption - and MPs warned last year it could take a decade for the gap between disadvantaged pupils and others to narrow to what it was before the pandemic.

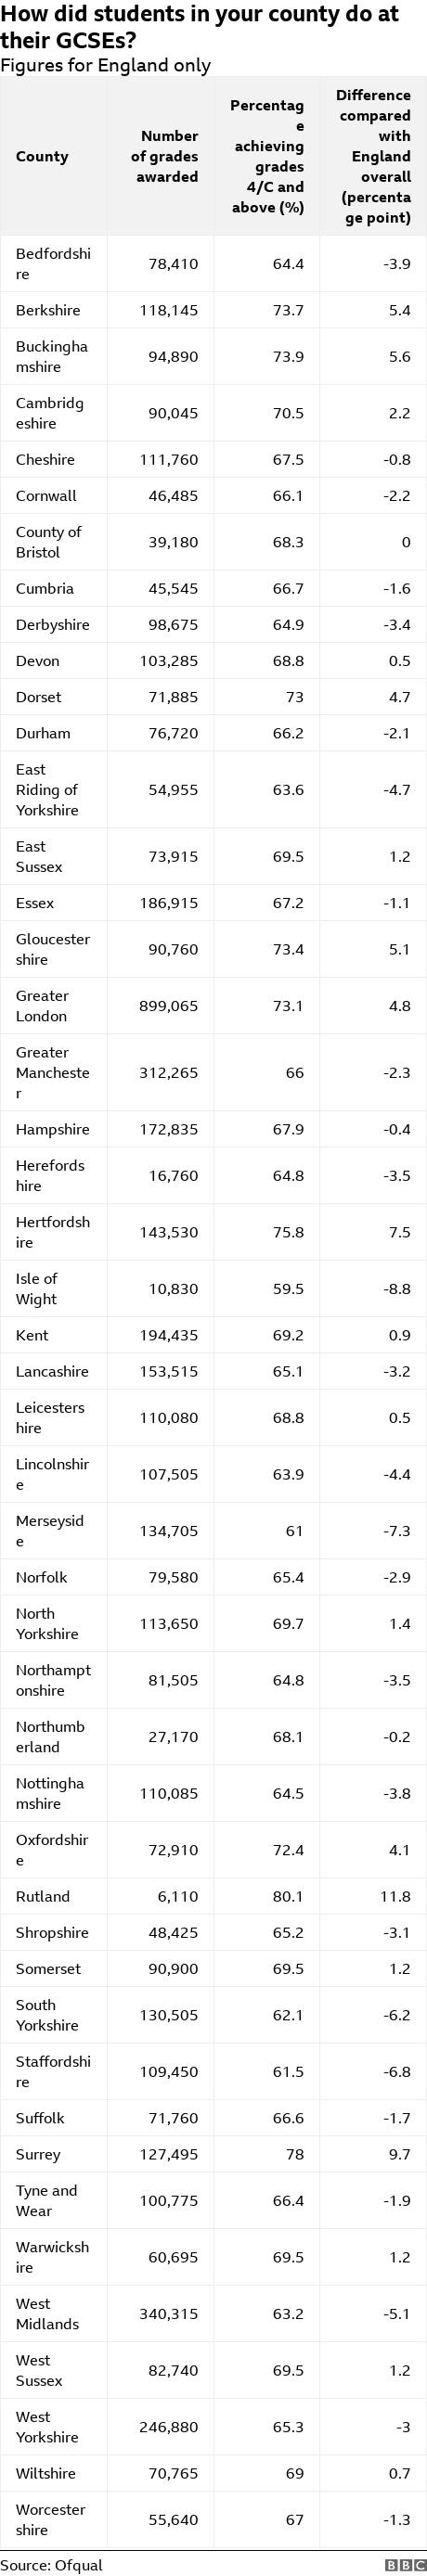
The results for each English county are shown in the table at the end of this story.
4. Resits to rise as hundreds of thousands fail maths or English
The pass rate among 16-year-olds sitting English language and maths in England is slightly worse than last year but better than 2019.
But because the 16-year-old population has grown since the pandemic, the number failing the subjects is higher than in 2019 or 2023.
In England, students need maths and English GCSEs at grade 4 or above to qualify for further study - although they can study for resits alongside their new subject choices.
Colleges say they already had to expand class sizes and hire exam halls to cope with last year’s rise – due to pupil population growth and grades being brought down to 2019 levels in England.
This year, they will have to prepare for even more resit students.
The data suggests about:
182,000 16-year-olds will need to resit English language
176,000 will need to resit maths
We do not know exactly how many students who were in Year 11 last year resat exams this summer but the number of 17-year-olds taking English language and maths gives an indication – and there has been rapid growth there.
But the pass rate among these 17-year-olds was just:
22.1% in English language
18.3% in maths
And the Association of Colleges is now questioning whether the system of compulsory GCSE resits is appropriate, while the Association of School and College Leaders has called it “demoralising”.

Additional reporting by Rob England, Phil Leake and Gerry Fletcher
How did students in your county do at their GCSEs?
Figures for England only
| County | Number of grades awarded | Percentage achieving grades 4/C and above (%) | Difference compared with England overall (percentage point) |
|---|---|---|---|
| Bedfordshire | 78,410 | 64.4 | -3.9 |
| Berkshire | 118,145 | 73.7 | 5.4 |
| Buckinghamshire | 94,890 | 73.9 | 5.6 |
| Cambridgeshire | 90,045 | 70.5 | 2.2 |
| Cheshire | 111,760 | 67.5 | -0.8 |
| Cornwall | 46,485 | 66.1 | -2.2 |
| County of Bristol | 39,180 | 68.3 | 0 |
| Cumbria | 45,545 | 66.7 | -1.6 |
| Derbyshire | 98,675 | 64.9 | -3.4 |
| Devon | 103,285 | 68.8 | 0.5 |
| Dorset | 71,885 | 73 | 4.7 |
| Durham | 76,720 | 66.2 | -2.1 |
| East Riding of Yorkshire | 54,955 | 63.6 | -4.7 |
| East Sussex | 73,915 | 69.5 | 1.2 |
| Essex | 186,915 | 67.2 | -1.1 |
| Gloucestershire | 90,760 | 73.4 | 5.1 |
| Greater London | 899,065 | 73.1 | 4.8 |
| Greater Manchester | 312,265 | 66 | -2.3 |
| Hampshire | 172,835 | 67.9 | -0.4 |
| Herefordshire | 16,760 | 64.8 | -3.5 |
| Hertfordshire | 143,530 | 75.8 | 7.5 |
| Isle of Wight | 10,830 | 59.5 | -8.8 |
| Kent | 194,435 | 69.2 | 0.9 |
| Lancashire | 153,515 | 65.1 | -3.2 |
| Leicestershire | 110,080 | 68.8 | 0.5 |
| Lincolnshire | 107,505 | 63.9 | -4.4 |
| Merseyside | 134,705 | 61 | -7.3 |
| Norfolk | 79,580 | 65.4 | -2.9 |
| North Yorkshire | 113,650 | 69.7 | 1.4 |
| Northamptonshire | 81,505 | 64.8 | -3.5 |
| Northumberland | 27,170 | 68.1 | -0.2 |
| Nottinghamshire | 110,085 | 64.5 | -3.8 |
| Oxfordshire | 72,910 | 72.4 | 4.1 |
| Rutland | 6,110 | 80.1 | 11.8 |
| Shropshire | 48,425 | 65.2 | -3.1 |
| Somerset | 90,900 | 69.5 | 1.2 |
| South Yorkshire | 130,505 | 62.1 | -6.2 |
| Staffordshire | 109,450 | 61.5 | -6.8 |
| Suffolk | 71,760 | 66.6 | -1.7 |
| Surrey | 127,495 | 78 | 9.7 |
| Tyne and Wear | 100,775 | 66.4 | -1.9 |
| Warwickshire | 60,695 | 69.5 | 1.2 |
| West Midlands | 340,315 | 63.2 | -5.1 |
| West Sussex | 82,740 | 69.5 | 1.2 |
| West Yorkshire | 246,880 | 65.3 | -3 |
| Wiltshire | 70,765 | 69 | 0.7 |
| Worcestershire | 55,640 | 67 | -1.3 |