Rates stay low but fears grow of a market bubble
- Published

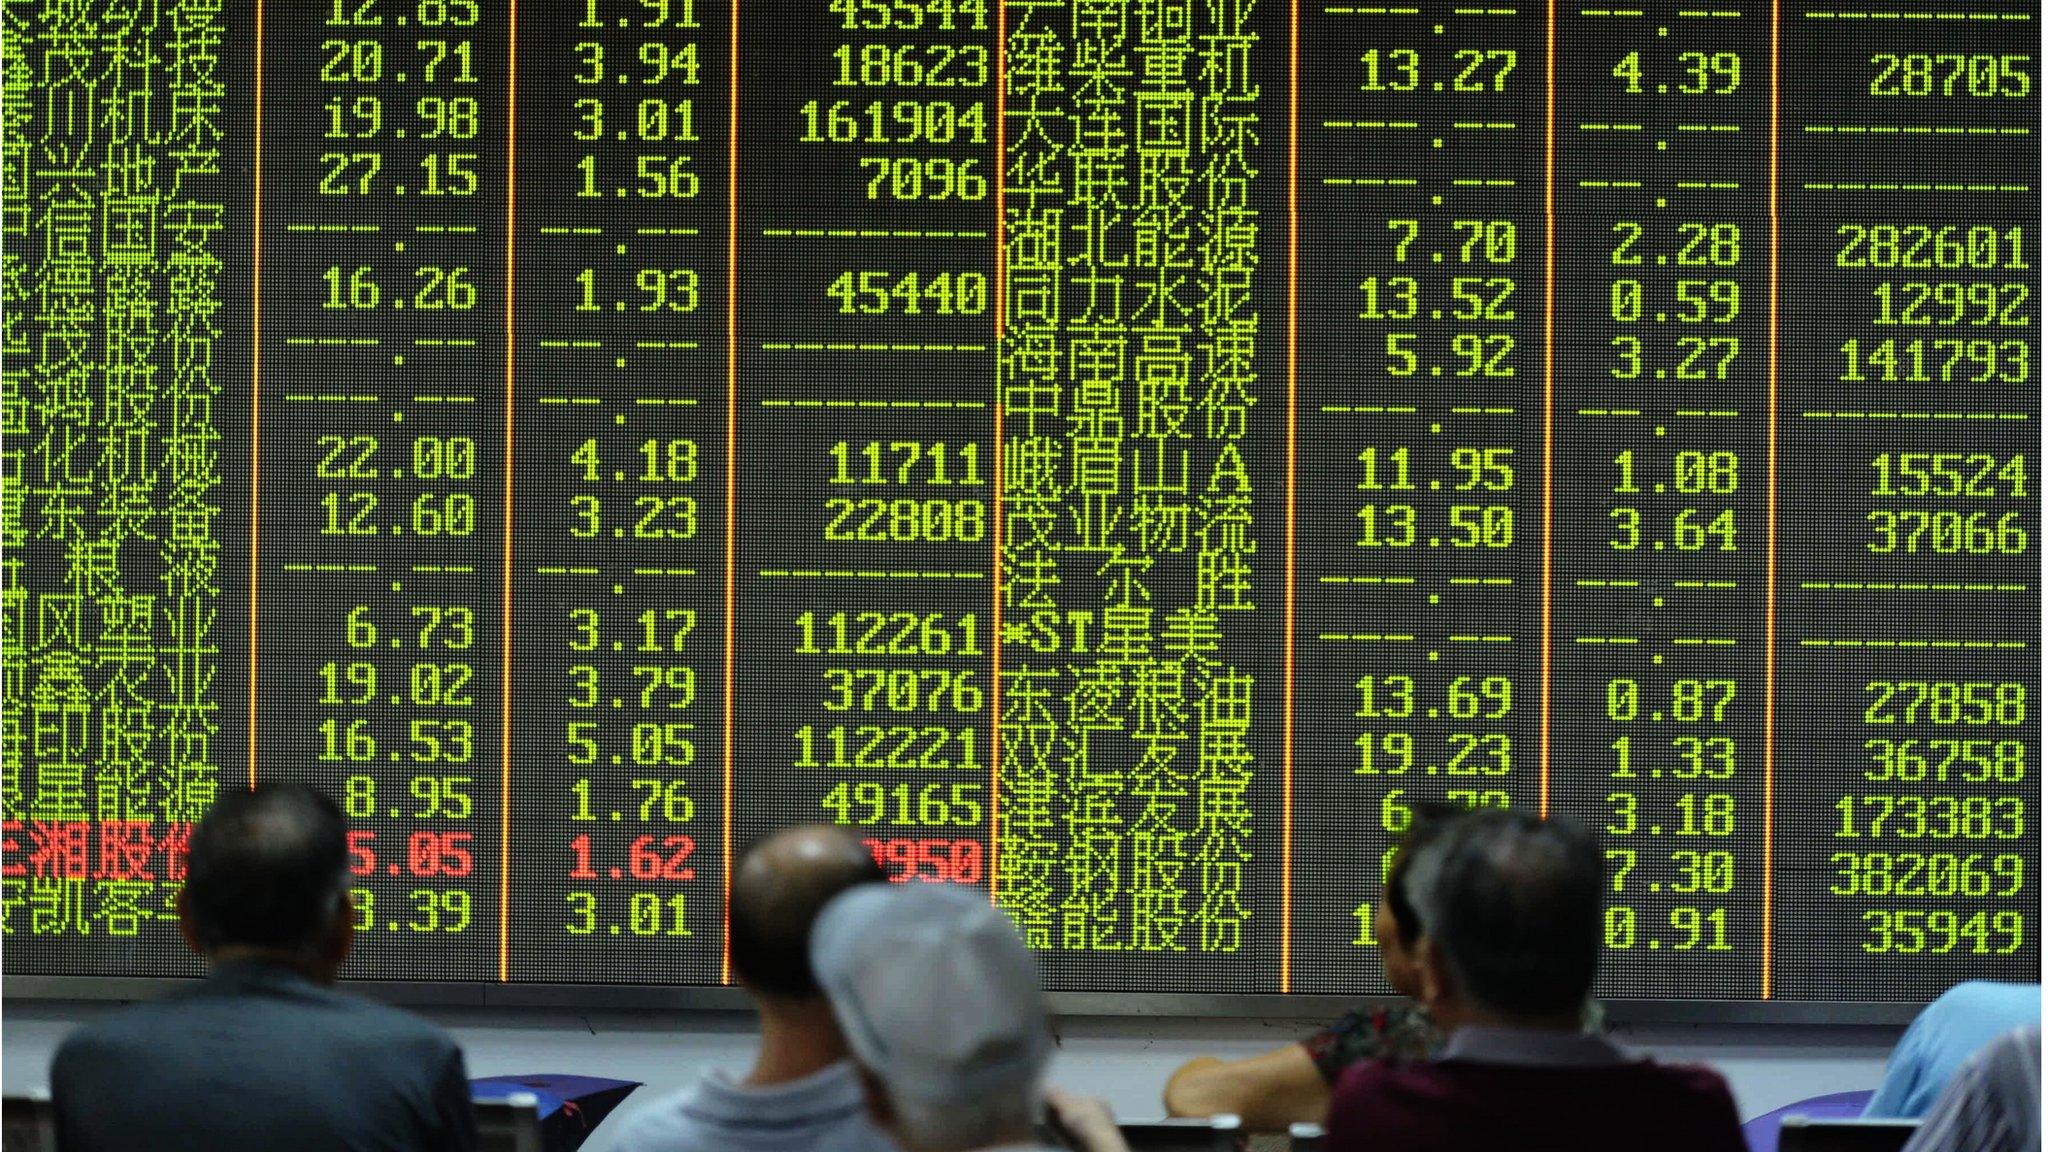
An American bubble about to burst?
No increase in interest rates - crack open the champagne - another month (or two or three) of cheap money.
There may well be a few investors breathing a sigh of relief that the Federal Reserve has kept US interest rates on hold.
But most realise that the days of cheap money are coming to an end.
Only now are we beginning to look at the stock market, blown up by cheap money over the last six years, and starting to question the resilience of this quivering balloon.
With rates close to zero the stock market has been the first choice for anyone hungry for a decent return since March 2009.
And in their enthusiasm those investors may well have inflated a bubble of alarming proportions.
One valuation, known as Cape, and which gained popularity after the collapse of the dot.com boom in 2000, is flashing red and sending shivers through the market.
Cape stands for "cyclically adjusted price to earnings" ratio. Don't be put off by the jargon. It's not as hard as it sounds.
Cape fear
The price to earnings ratio (or PE) is the relationship between the price of a share in the market, and the earnings of the company to which it relates.
Simply divide the earnings by the number of shares and you get to see how much each individual share is "earning".
Then see how many times greater the share price is - five times, ten times, twenty, whatever. The higher you go the more likely it is that the share is overvalued.
The question is: which earnings are you going to use? This year's? Last year's? Next year's estimate?
Prof Robert Shiller, the Nobel laureate economist who popularised Cape, decided to use average earnings, adjusted for inflation, over the last ten years. The measure is sometimes also called PE10.
So, what's a high Cape and what's a low one? The historic average Cape for the S&P 500, the broad US market index, is 16.6. Its rock bottom was just below 5 in the early 1920s.
Last year Prof Shiller said that over 25, Cape was at "a level that has been surpassed since 1881 in only three previous periods: the years clustered around 1929, 1999 and 2007. Major market drops followed those peaks".
Now, I know what you're thinking.
Where are we now?
25.33.
Uh-oh...

The Cape ratio
Grab that phone
But before you grab the phone to your broker, it should be pointed out that no-one, Prof Shiller included, sees Cape as a predictor of a crash.
In fact had you used Cape to time your investment for most of this century you would have gone spectacularly wrong. For all that time Cape has been, with one brief exception in mid 2009, above its long term average of 16.6, i.e. telling you your returns were going to be below average.
Indeed according to Cape the market has been overvalued for all of the last six years.
Yet investors who plunged into the market in 2009 would have been rewarded, to date, with total returns (including dividends) of close to 200%.
Cape instead should be used to predict whether long term (preferably 10 year) future earnings for a company (or the market in general) are going to be below or above the historic average.
Even that use has its critics, who say that looking at past earnings over a decade can be distorted by changes in accounting practices or tax regimes. It doesn't take into account the state of a company's balance sheet which might, say, be loaded up with debt.
Working out an accurate view of earnings over a decade can be fiendishly difficult, complicated by new share issues, disposals, buy-backs and so on. And of course 10 years is too long to assess, say, Facebook or any number of new tech companies.

Robert Shiller
Blunt instrument
So this is, as many people have claimed, a fairly blunt instrument.
Mr Schiller, though, has other tools in his toolkit, and in particular his Stock Market Confidence indices, which show that both retail and institutional investors have been losing confidence in the stock market steadily over the last four or five years - even as they kept on buying.
It conjures up a curious picture of an investor putting the phone down after snapping up another $1m of Google stock muttering: "It's all going to hell - but I just can't help it."
Now combine these factors with one remaining element - earnings growth in the S&P500 - and things start to look fairly bleak.
Amidst all the hoopla around interest rates it's been easy to forget that US companies start reporting third quarter results next week. And it's not looking good.
The last quarter saw total earnings for companies in the S&P 500 index down 2.1% on the same period last year. The third quarter is likely to be worse, maybe 5.5% lower than last year.
Now a lot of that is to do with the energy sector getting knocked sideways by the low oil price, but other sectors are hardly shining. The bottom line is that earnings are at their weakest level in six years.
That in itself (let alone confidence levels and the Cape ratio) should make investors cautious. And interest rates haven't even gone up yet.
- Published17 September 2015
- Published25 August 2015
- Published24 August 2015