Reality Check: How much do we spend on rent?
- Published

In the UK, people are renting for longer periods of time, as buying a property has become more expensive and wages have struggled to keep up.
As analysis for the BBC by Hometrack reveals, the average length of residence for private renters in England has increased to 4.3 years.
This got Reality Check thinking about how much people are spending on rent.
If people are renting for a longer period of time, how much of their pay packet is going on accommodation?
Renting has overtaken buying
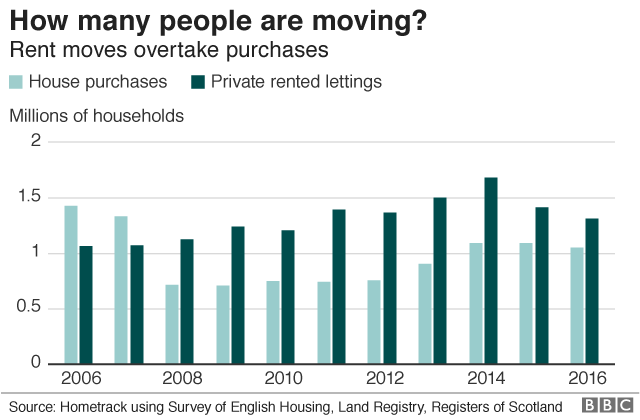
While home ownership has declined in recent years, the number of private rented lettings has gone up.
Between 2006 and 2016, the number of new private rented lettings increased by 24% to 1.3 million.
Since 2008, there have been more new private rented lettings a year than new sales.

There were a million residential sales in Great Britain in 2016.
However, it's important to remember that the average length that a homeowner will stay in their home is about 20 years on average, so turnover would typically be lower.
The number of private rented lettings did fall from 2014 to 2016, as the average length of a tenancy increased, meaning that tenants were staying longer in their rental properties too.
Rental prices have gone up
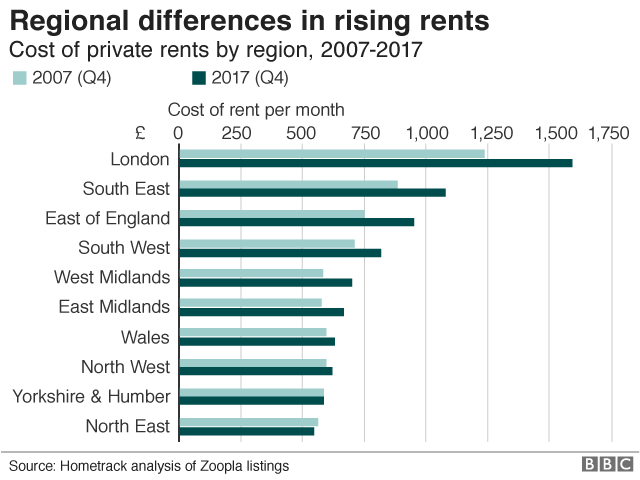
According to data from residential property analysts Hometrack, the average cost of rent per calendar month increased by 19% from 2007 to 2017 for private rents in England and Wales.
Over the same period, real average weekly earnings in the UK fell from £463 in January 2007 to £458 in 2017, according to the Office for National Statistics, external (ONS).

London saw the largest rise in the past decade, with a 29% increase in how much the capital's renters are paying each month.
In 2017, the average private rent in London stood at £1,590 per calendar month. London topped the regional list for median earnings for full-time employees in April 2017, at £692 per week.
However, in the North East, the amount paid for private rents per month decreased by 3% over the past 10 years, falling to £544.
But, affordability varies across the regions
The government's definition of affordable housing says that affordable homes for rent shouldn't cost any more than 80% of the average local market rent.
Most definitions of affordability take into account the relationship between the average household income and the average rent in an area.
Analysis by Hometrack of data from the ONS looked at the ratio between average annual salaries and house prices.
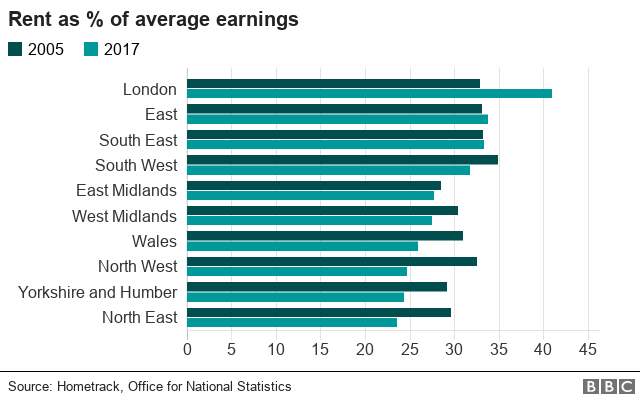
It found that rent as a percentage of annual earnings across England and Wales had decreased from 31.1% in 2007 to 29.4% 10 years on.

London was the least affordable region in England and Wales, with city-dwellers spending 41.1% of their annual salaries on rent in 2017.
One of the reasons rental affordability in London has become stretched is the fact that more renters are sharing properties. This has pushed up rents ahead of earnings, as landlords charge more to groups of professionals occupying a property, according to Hometrack.
The most affordable region was the North East, with the region's renters handing over 23.6% of their annual salaries on rent last year.

Where can you afford to live? Try our housing calculator to see where you could rent or buy
This interactive content requires an internet connection and a modern browser.


- Published30 April 2018

- Published24 April 2018

- Published17 April 2018