House prices rise fastest in North West
- Published
- comments
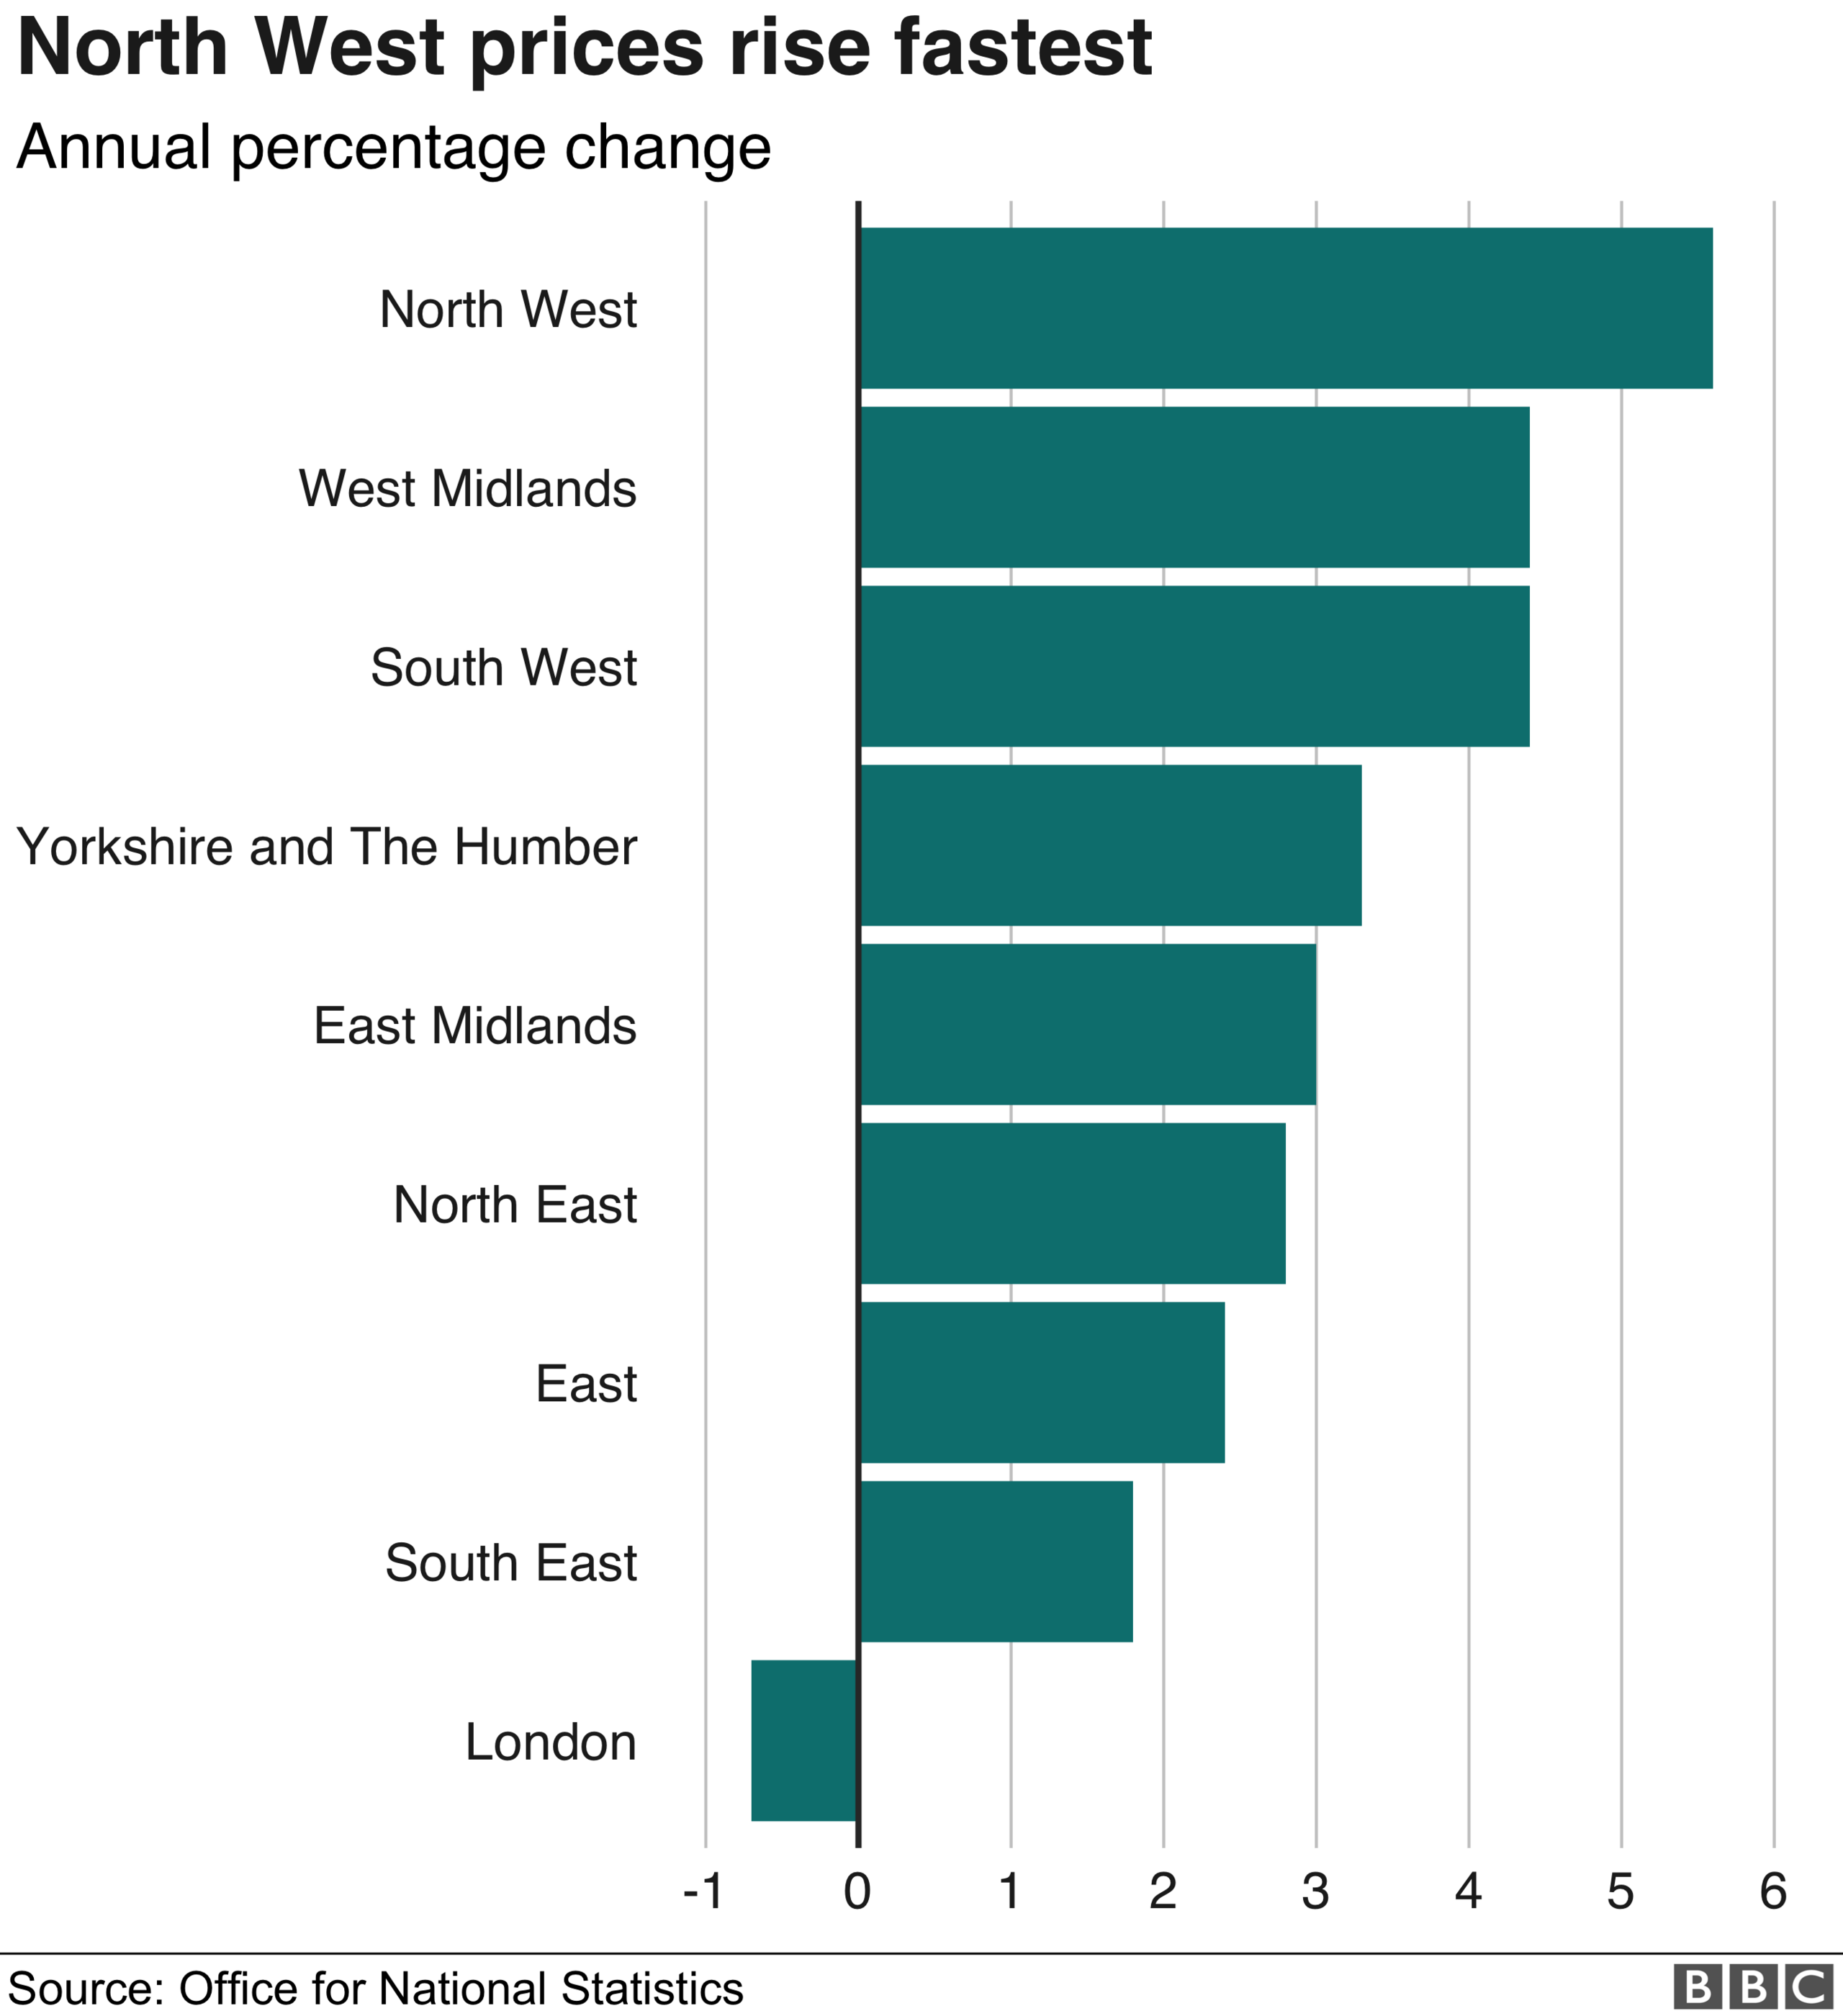
House prices in the North West rose the fastest in the UK compared with a year ago, according to official figures.
Annual growth in property values in the region stood at 5.6% by July, the Office for National Statistics (ONS) said.
The biggest fall was in London, where prices dropped by 0.7% year-on-year.
However, the capital had the highest average house price of £484,926 - almost four times higher than the North East.
The typical property price of £131,505 in the North East of England was up by 2.8% in the last year.
The South West and West Midlands regions both experienced price hikes of 4.4%, while the South West posted the second-lowest annual growth of 1.8% in the year to July 2018.
Shaun Church, director at mortgage broker Private Finance, said: "House price performance remains incredibly varied across the UK. London is the only UK region experiencing falling prices, as buyers increasingly look to the commuter belt for more affordable properties."
Recent research from Post Office Money suggested that towns within a commutable distance of London, such as Reading and Luton, had seen nearly 10% property price growth over the last year.
"With first-time buyers increasingly citing location as an area they are willing to compromise on, it follows that buyers have been looking for more affordable yet commutable options," said Chrysanthy Pispinis from the lender.
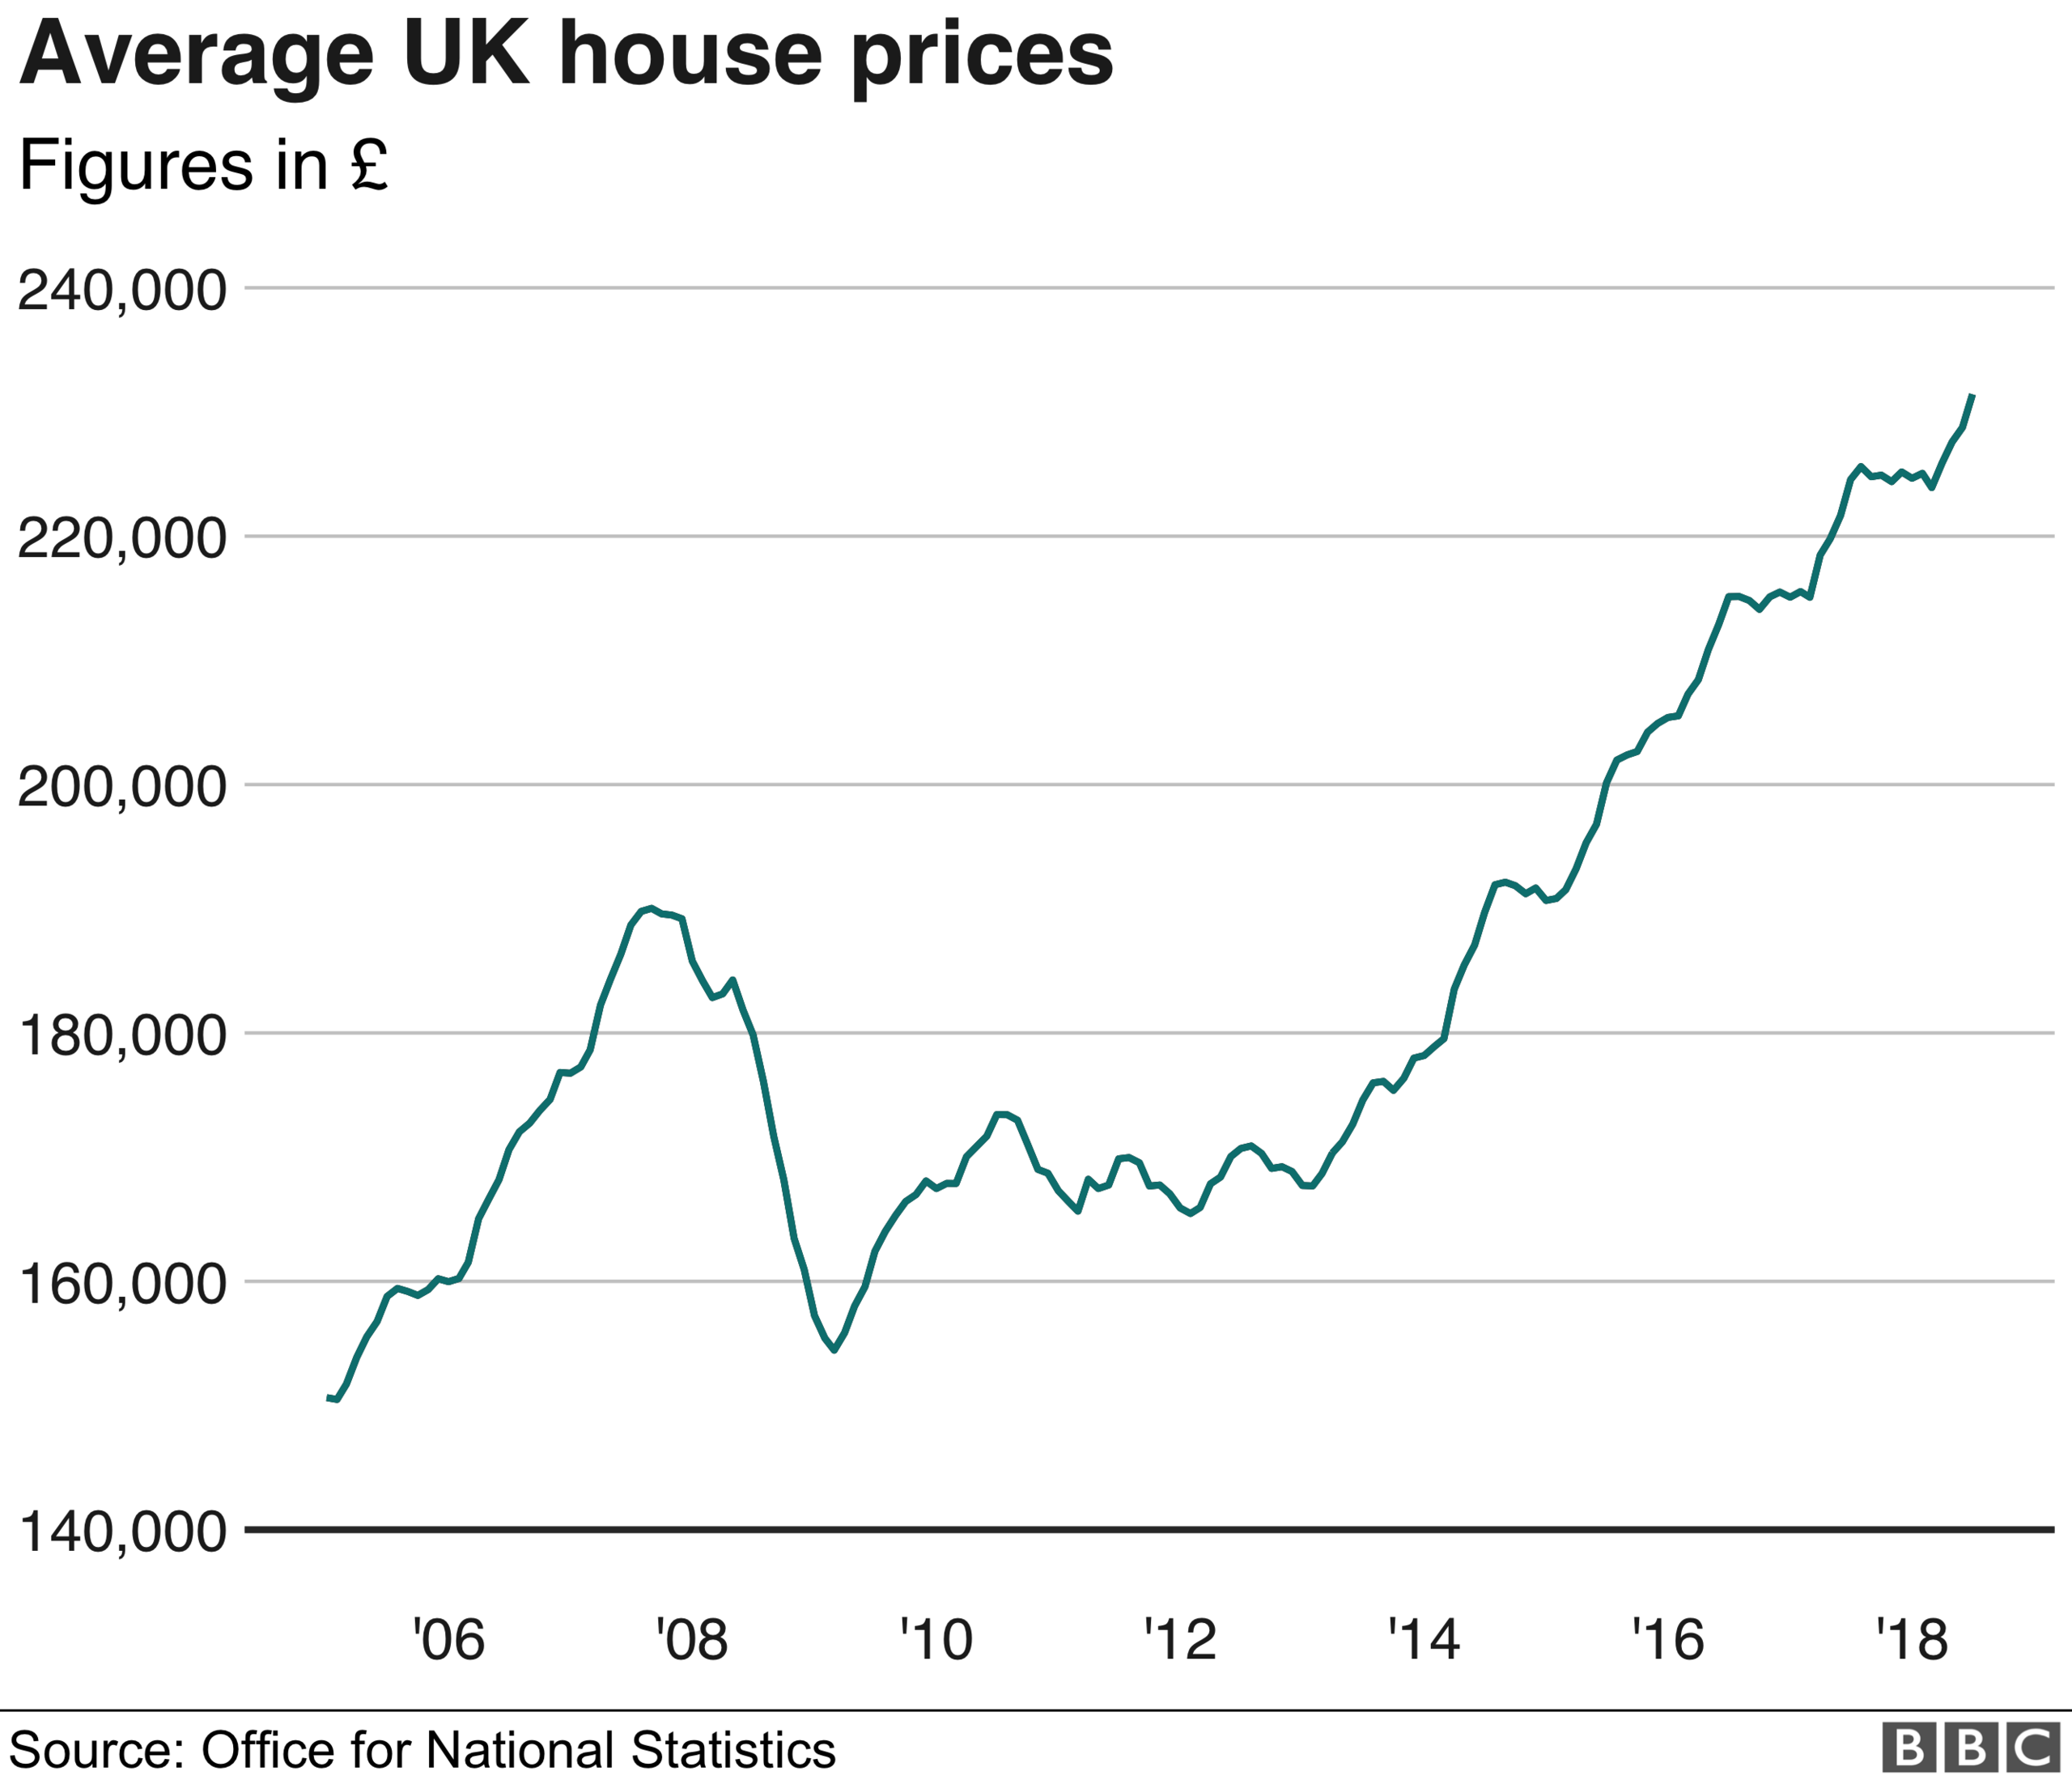
Average house prices in the UK increased by 3.1% in the year to July. That was a slight fall from June's 3.2% annual increase and the lowest UK annual rate since August 2013, when it was 3%.
Mike Hardie, head of inflation at the ONS, said: "UK house prices continued to grow, but at their lowest annual rate for five years, driven again by a fall in London."
The average UK house price was £231,000 in July, some £6,000 higher than in July 2017 and £2,000 higher than last month.
Average house prices increased by 0.3% between June and July.
The average price in England rose annually by 2.7% to £245,000, went up by 4.3% to £157,000 in Wales, increased by 4.8% over the year to £150,000 in Scotland, and went up by 4.4% in Northern Ireland to £133,000.
How are different types of properties performing?
Detached houses showed the biggest increase in the period, climbing by 4.6% in the year to July 2018 to £352,000.
The average price of flats and maisonettes increased by 0.6% in the 12 months to July, to £208,000, the lowest annual growth of all property types.
The weaker growth in UK flats and maisonettes was driven by negative annual growth in London for the property type, the ONS reported.
London accounts for about a quarter of all UK flats and maisonettes changing hands.
Separate figures from the ONS showed that the cost of renting in Britain rose by 0.9% in the 12 months to August 2018, unchanged from last month. But London prices decreased 0.3% over the period.
Kate Davies of the Intermediary Mortgage Lenders' Association said: "While rent increases are subdued over the last 12 months, it is likely that this will only be a temporary respite.
"The cumulative impact of successive government regulation implemented two years ago, namely the 3% stamp duty surcharge and the removal of mortgage interest tax relief, means we may soon start to witness a more pronounced impact on the sector."
Where can you afford to live? Try our housing calculator to see where you could rent or buy
This interactive content requires an internet connection and a modern browser.
- Published9 July 2020
- Published15 August 2018

- Published10 November 2017
