Is rent cheaper in the next street? Use our map to find out
- Published

How much do you pay your landlord? Could you save by moving down the road, or getting an extra flatmate?
Rent can swallow more than half of young people's salaries. Yet the difference in cost between neighbouring postcodes can be as high as 50%.
The BBC data team, using figures from Hometrack, has mapped rents by postcode district in Britain to help you explore the best value parts of your area.
You can also change the number of bedrooms to see how much you could save by sharing a larger home.
Contains OS data © Crown copyright and database rights 2018. Postcodes have been matched to the local council where the majority of that postcode falls. This could mean you get a different local authority to the one you expect. There is insufficient data for Northern Ireland. If you can't see the map, tap or click here, external.
For one-bedroom flats, rent in the most expensive postcode districts in three local authorities - Westminster, the Scottish Borders and the City of London - is more than twice as expensive as the cheapest postcode.
Significant price gaps can also be found in Powys, Northumberland, Leeds, Fife, and Manchester. Within all of these areas, the most expensive postcode district was more than two-thirds pricier than the cheapest one.
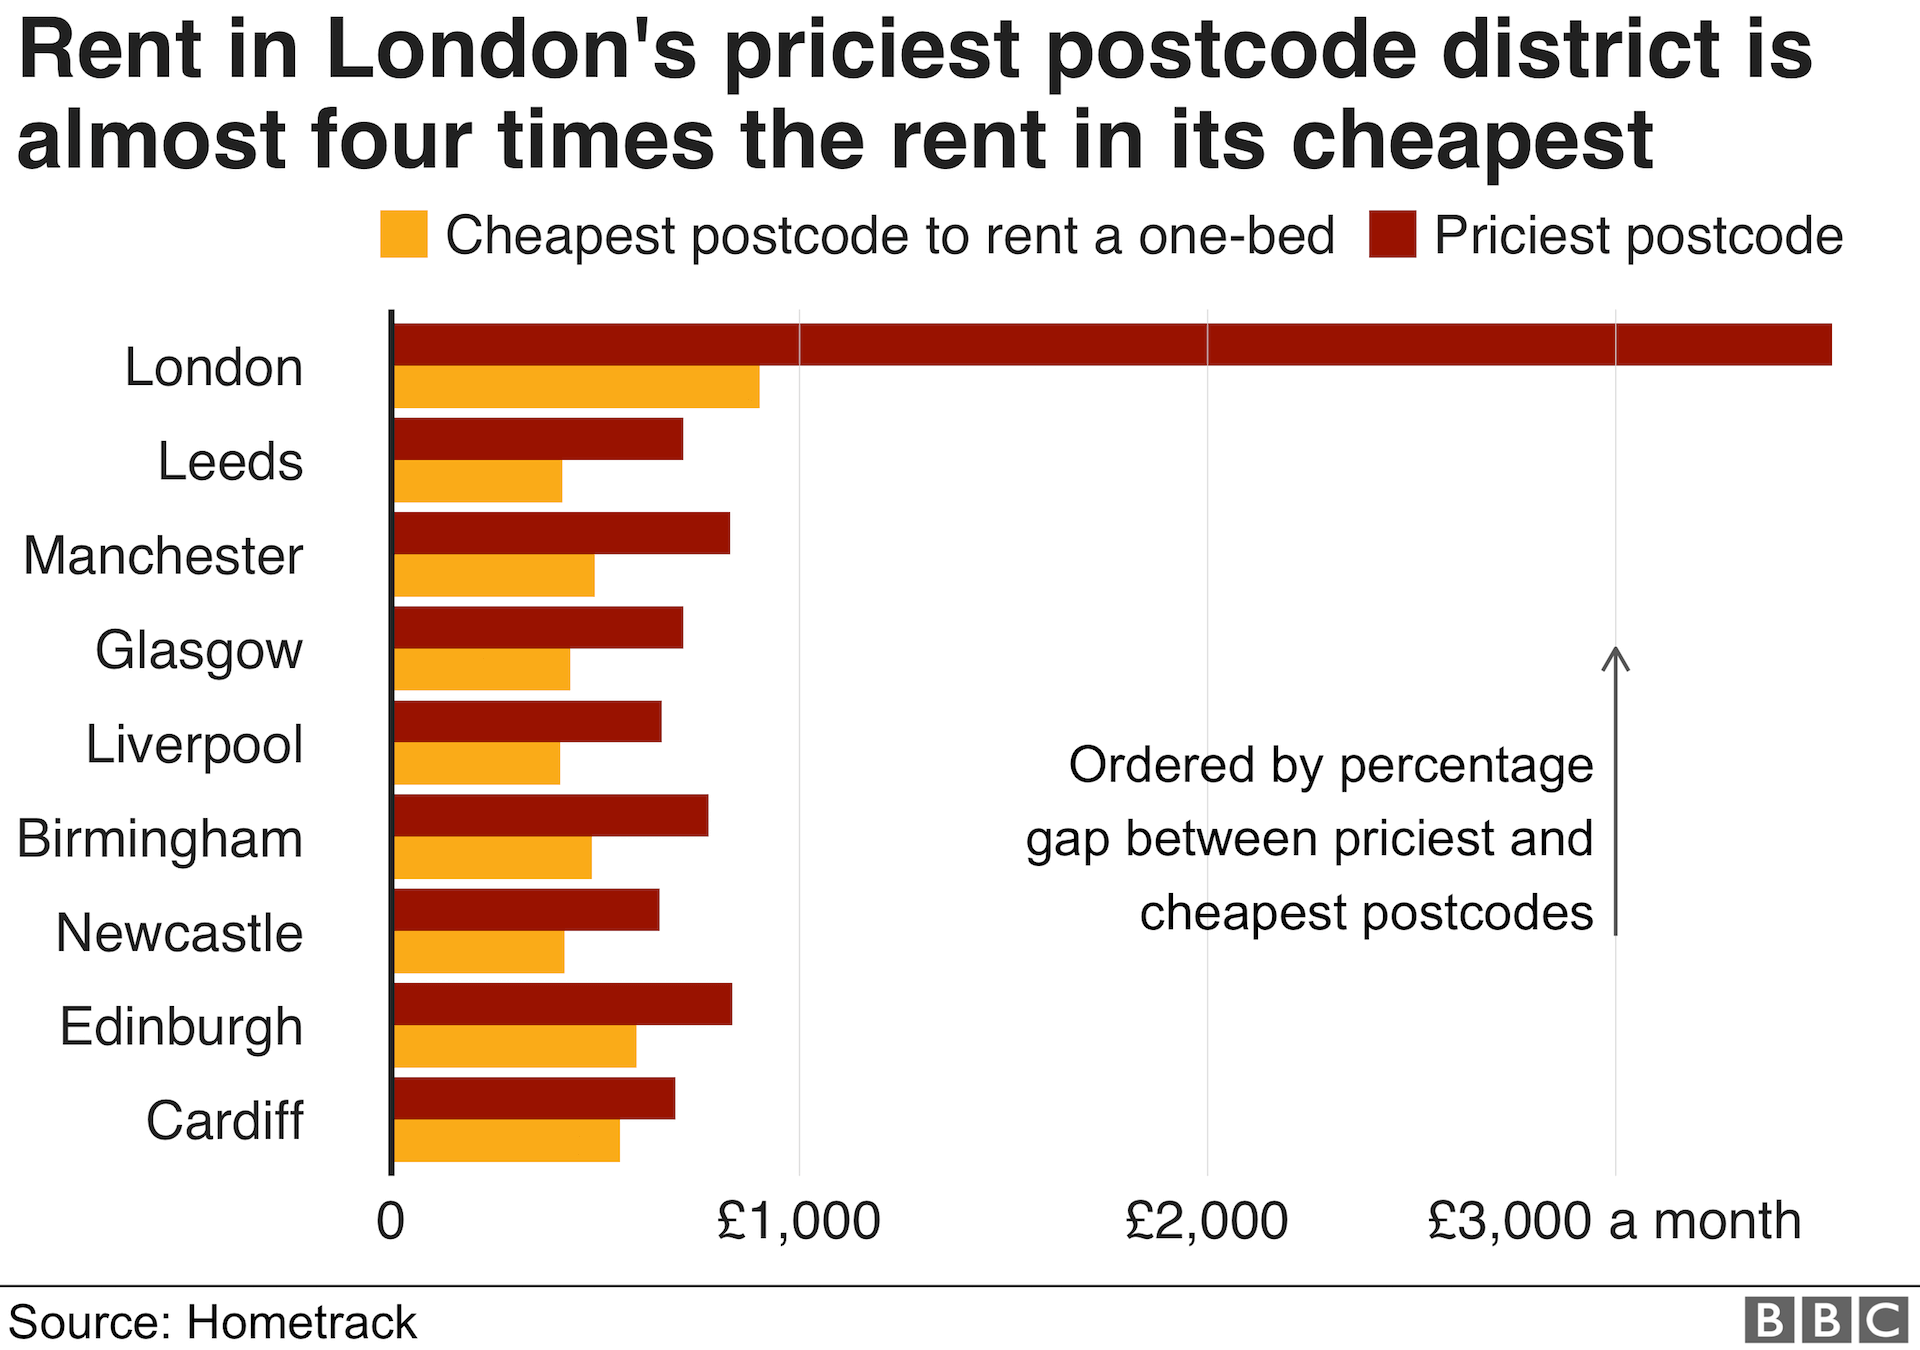
While areas with more postcode districts might be expected to have larger gaps between the cheapest and most expensive ones, the difference across London as a whole was stark. The priciest postcode - SW1X in Westminster, is almost four times as expensive as the cheapest, SE2 in Greenwich.
Last month, BBC analysis revealed that people in their 20s who wanted to rent a place for themselves faced having to pay out an "unaffordable" amount in two-thirds of Britain.
Average rents for a one-bedroom home accounts for more than 30% of the typical salary of someone in their 20s in 65% of British postcode areas.
Many housing organisations regard spending more than a third of income on rent as unaffordable.
Landlords said they faced costs, including their mortgages, insurance, maintenance and licensing, that needed to be covered from rents.

Methodology
Rent figures show the median rent broken down by property size and postcode district for Great Britain, and were produced for the BBC by Hometrack, based on a snapshot value from March 2018. There was insufficient data on Northern Ireland.
Local authorities and postcode districts do not match up exactly. Each postcode district has been joined to the local authority it most closely matches, except where it made editorial sense to group certain postcodes together (such as when a major city returned just one postcode district).
Designed by Debie Loizou, and developed by Scott Jarvis and Steven Connor.
- Published3 October 2018

- Published11 May 2018

- Published9 July 2020

- Published11 May 2018

