Housing crisis: Where are the most new homes being built?
- Published

There is huge demand for more homes to be built.
More people are living alone, external and growing numbers of young people are living with their parents because they cannot afford their own place.
But everything from where all the new homes should go to how big they are is a source of much debate.
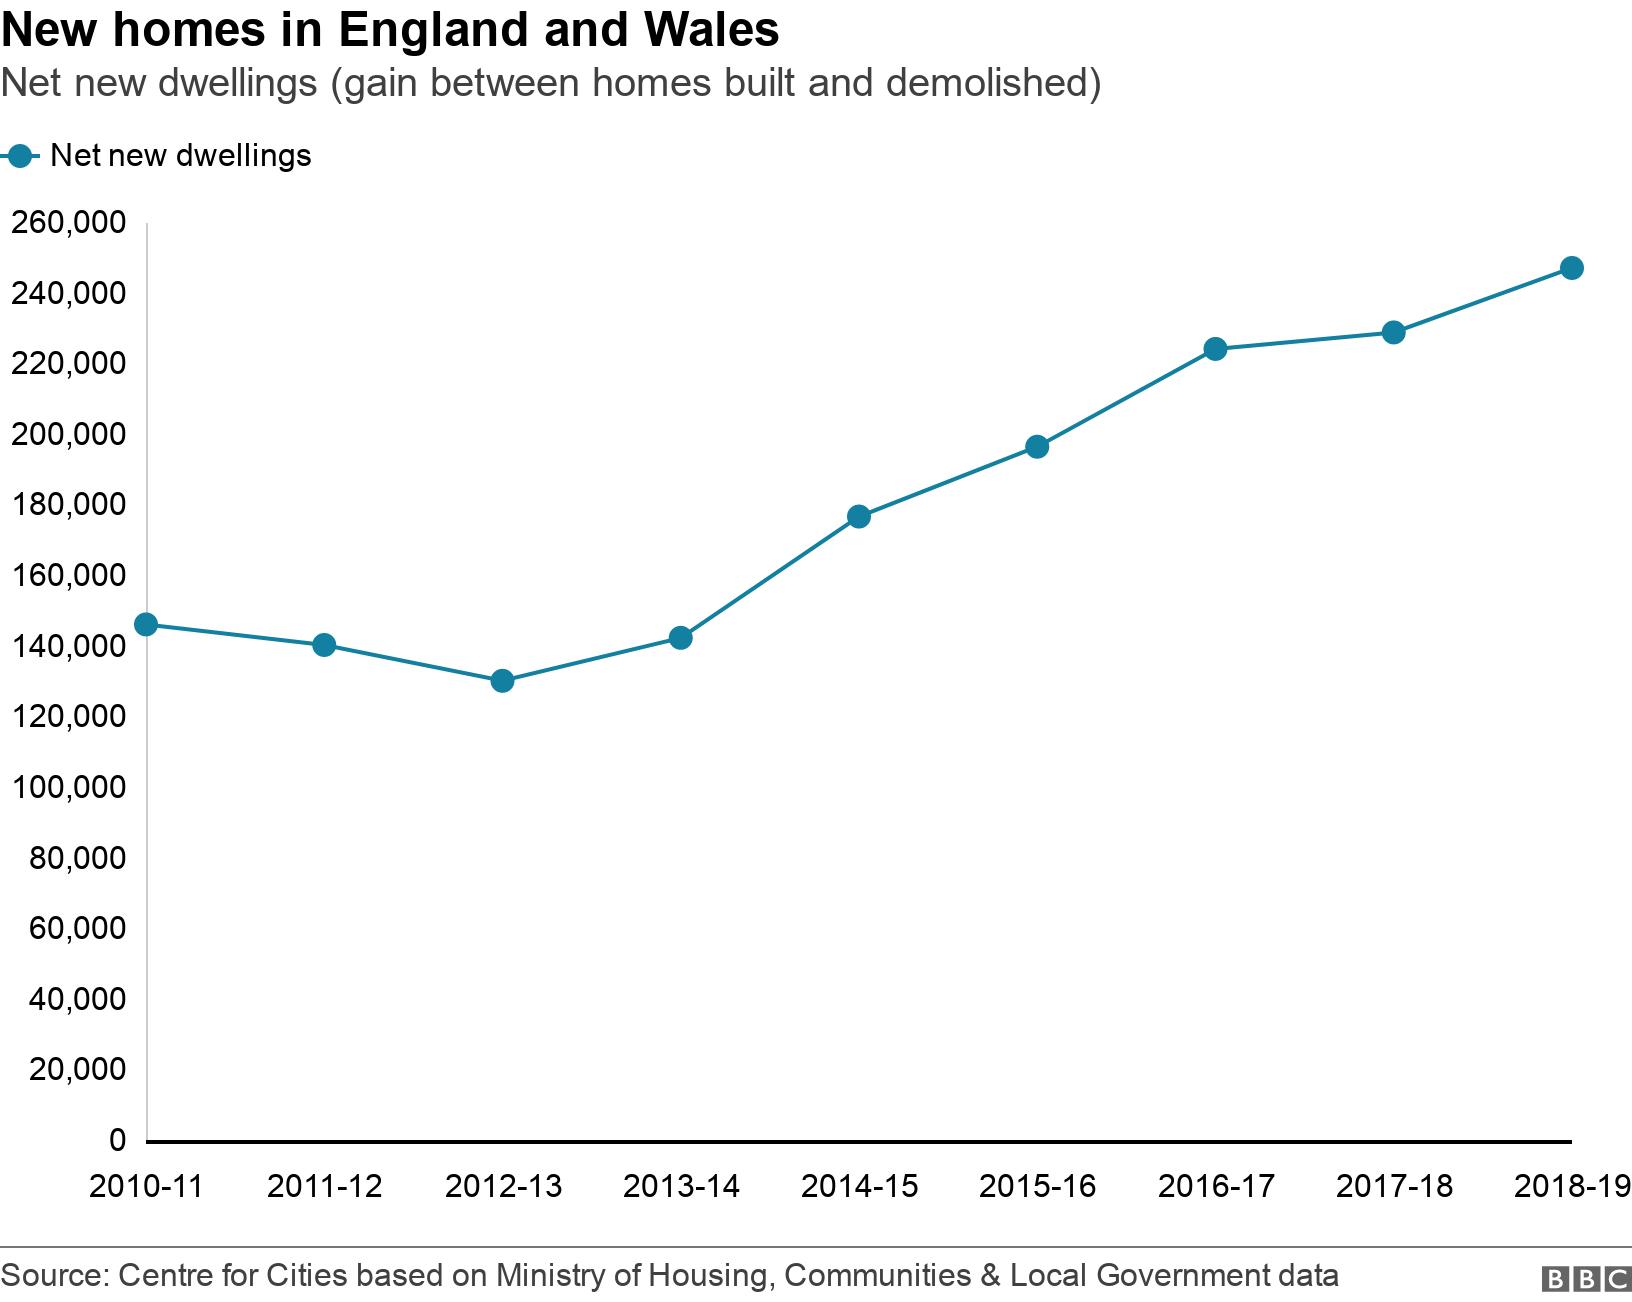
How many homes are being built?
There are 247,000 more houses being built in England and Wales every year than are demolished.
This is less than a government target of 300,000 new homes in England alone each year but a big increase from a low of 130,000 homes in 2012-13.
Are cities expanding?
The most new homes have been built in cities and large towns - defined by the Centre for Cities as places with a daytime population of at least 135,000., external About 803,000 were created in these places between 2011 and 2019.
And while 734,000 of these were built in the suburbs, about 69,000 are in city centres, a rise of 16% over the past eight years. This compares with an overall increase of 6% for England and Wales.
However, building has increased elsewhere too. Since 2011, 735,000 homes have been built away from main centres, although more than three-quarters of them are within commutable distance of a city or large town.
Places such as Corby, midway between Peterborough, Northampton and Leicester, and Uttlesford, the local authority near Cambridge that includes Stansted Airport, have been big builders.
Which towns and cities have the most new homes?
London has unsurprisingly built the most homes, with 307,000 since 2011. That's the equivalent of two extra cities the size of Sunderland or one Bristol. Tower Hamlets has been the largest contributor to this overall total, with 23,600.
But on a percentage basis, Cambridge has seen the largest growth. It has increased its number of homes by 15%, or more than 7,000. It was followed by Telford (12%, 8,400), Milton Keynes (11%, 11,700) and Peterborough (10%, 7,500).
The data for England and Wales is based on new homes with an Energy Performance Certificate (EPC).
This data is not available for Scotland or Northern Ireland. However, other data shows Edinburgh and its surrounding authorities of Midlothian and East Lothian have seen the most house-building in Scotland,
And Belfast has built at least 10,500 homes since 2011, accounting for about a quarter of the total increase in homes in Northern Ireland.


How big are new homes?
The average new home was 92 sq m (990 sq ft), compared with 89 sq m for an existing home (just larger than a badminton court).
But this varies across the country.
New homes in city centres were the smallest, at 64 sq m (just larger than a squash court). Outside cities, they averaged 101 sq m.

And the average size of a new home was larger in the North of England than the South.
Among large towns and cities, Blackpool built the largest homes, at 101 sq m, while Luton built the smallest, at 62 sq m.


Download the full BBC Briefing on housing here, external. Part of a mini-series of downloadable guides to the big issues in the news, it has input from academics, researchers and journalists and at the end there's a glossary, external of useful terminology.
Are homes where they are needed?
Cities close to and including London tend to be the least affordable places to live.
For example, the average home was about 17 times average salaries in Oxford in 2019, compared with four times salaries in Burnley.
But Oxford and Burnley have built a similar number of new homes since 2011 - 2,400 compared with 2,100.
Cities such as Oxford and Brighton are desirable places to live because of their successful economies, which offer access to large numbers of well paid jobs.
If it is not to become ever more difficult for first-time buyers to get on to the housing ladder in these cities, or for renters to not see ever more of their pay cheques disappearing on rent, then more homes will be needed to meet demand.
More like this:
But elsewhere - in Burnley, Hull and Barnsley, for example - increasing the number of new homes is not always the answer to helping the local economy grow. Instead, creating more jobs first may be the solution.
And there may be alternatives to building new homes, such as filling empty houses and providing a broader range of better-quality properties.
But the government plans to level up the economy by introducing more employment opportunities in different parts of the country.
And if that happens, demand for new homes may grow in these areas too, not just in the least affordable cities.
Number of new homes and percentage growth in England and Wales (2011-19)
Aldershot 4,671 (6%)
Barnsley 6,837 (7%)
Basildon 4,252 (6%)
Birkenhead 3,495 (2%)
Birmingham 41,901 (4%)
Blackburn 1,814 (3%)
Blackpool 3,678 (3%)
Bournemouth 9,552 (4%)
Bradford 8,841 (4%)
Brighton 4,193 (3%)
Bristol 20,535 (7%)
Burnley 2,081 (3%)
Cambridge 7,410 (15%)
Cardiff 5,734 (4%)
Chatham 5,307 (5%)
Coventry 7,803 (6%)
Crawley 2,647 (6%)
Derby 3,478 (3%)
Doncaster 7,164 (5%)
Exeter 4,133 (8%)
Gloucester 3,630 (7%)
Huddersfield 6,824 (4%)
Hull 6,279 (5%)
Ipswich 2,173 (4%)
Leeds 15,627 (5%)
Leicester 12,760 (7%)
Liverpool 18,202 (7%)
London 306,811 (8%)
Luton 3,459 (5%)
Manchester 50,839 (5%)
Mansfield6,018 (6%)
Middlesbrough 11,852 (6%)
Milton Keynes 11,683 (11%)
Newcastle 19,022 (5%)
Newport 7,361 (7%)
Northampton 5,301 (6%)
Norwich 6,859 (6%)
Nottingham 9,871 (4%)
Oxford 2,351 (4%)
Peterborough 7,482 (10%)
Plymouth 6,447 (6%)
Portsmouth 9,811 (4%)
Preston 9,720 (6%)
Reading 12,368 (10%)
Sheffield 15,057 (4%)
Slough 3,835 (7%)
Southampton 11,281 (7%)
Southend 5,271 (3%)
Stoke 6,089 (4%)
Sunderland 6,036 (5%)
Swansea 6,331 (4%)
Swindon 6,762 (7%)
Telford 8,363 (12%)
Wakefield 11,567 (8%)
Warrington 4,327 (5%)
Wigan 6,015 (4%)
Worthing 2,550 (5%)
York 1,025 (3%)

About this piece
This analysis piece was commissioned by BBC News from an expert working for an outside organisation.
Paul Swinney is director of research and policy and Anthony Breach is an analyst at the Centre for Cities, which describes itself as working to understand how and why economic growth and change takes place, external in the UK's cities.
You can follow Paul on Twitter here, external and Anthony here., external

Edited by Ian Westbrook

Have you bought a new home recently? Where should new homes be built? Share your experiences by emailing haveyoursay@bbc.co.uk, external.
Please include a contact number if you are willing to speak to a BBC journalist. You can also contact us in the following ways:
WhatsApp: +44 7756 165803
Tweet: @BBC_HaveYourSay, external
Send pictures/video to yourpics@bbc.co.uk, external
Please read our terms & conditions and privacy policy
- Published22 June 2018