How bad has winter been for the NHS?
- Published

This has been the most difficult winter for the NHS for a long time. Wherever you live in the UK, local services have been under strain.
The four-hour target to be seen in A&E has been missed in each nation - and that has had a knock-on effect on other parts of the hospital system.
The BBC has been following how the health service has been doing through its NHS Winter project, which has tracked the performance of each hospital trust since November. Friday marks the last day we will be publishing the detailed breakdown.

The worst yet?

Get involved on:
In England all the evidence points to it being the worst winter since the target was introduced at the end of 2004.
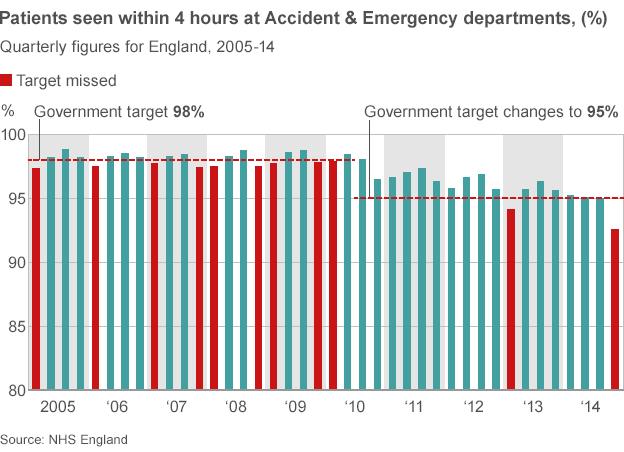
The graph below shows performance since then, and is up to date to the end of December 2014. The target is officially measured on a quarterly basis and covers the point from arrival to when a patient is discharged, transferred elsewhere or admitted into hospital for further treatment, .
During the last three months of 2014 92.6% were seen within four hours - the worst figure during this whole period.
We will have to wait until the end of March to get the next quarterly data, but performance is on track to be even worse than that.
And NHS England has already admitted the average for the whole of 2014-15 will be below 95% - the first time this has happened for a whole year under the target.

Unprecedented pressures
The situation was particularly bad at the turn of the year. A number of hospitals had to declare major incidents, a move normally associated with accidents involving multiple injuries.
Those who work in hospitals have said the pressures were unprecedented, as Scarborough Hospital boss Mike Proctor explains in this video.
Mike Proctor, Scarborough Hospital: "I'm seeing pressures in this system we have never seen before"
He was speaking in early January as performance dipped to its worst level of winter, with just 86.7% of patients seen in four hours across the whole of the system. As you can see from the graph below, that is significantly worse than last winter.
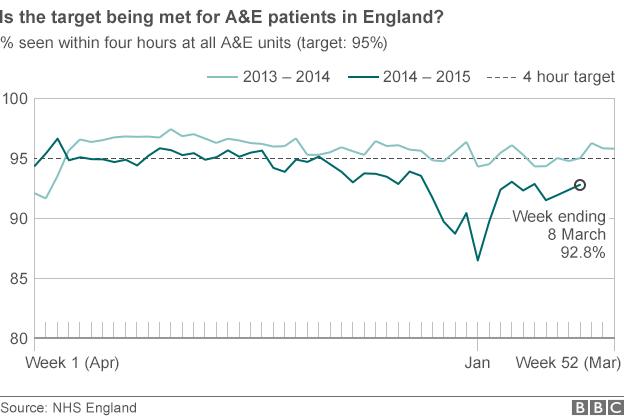
To the NHS's credit, performance did pick up after that point - although not enough to return above the 95% mark. However, it is worth noting that the health service has one of the toughest waiting time measures in the world.

Why Luton is unique
Another way to look at it is to see the performance of individual trusts. Take a look at this chart.
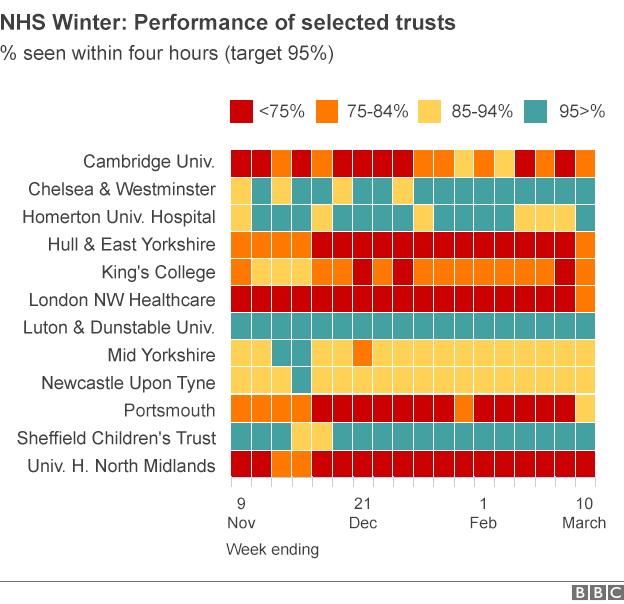
It is a snapshot of a larger chart (which you can see at the bottom of this page) that shows how each major hospital trust has been performing since the start of November. Blue signifies the target being hit during specific weeks, shades of yellow, orange and red show it has been missed.
The one that stands out is Luton and Dunstable University Hospital. It was the only trust out of 140 to have hit the target on a weekly basis throughout the period. Sixty-three missed the target every week for the whole of winter.

Not just an England issue
England - as the biggest health service and the one that produces the most up-to-date data - has received the most attention.
But the problems have been just as acute elsewhere in the UK. In fact, England could be said to have faired the best, as this graph shows.
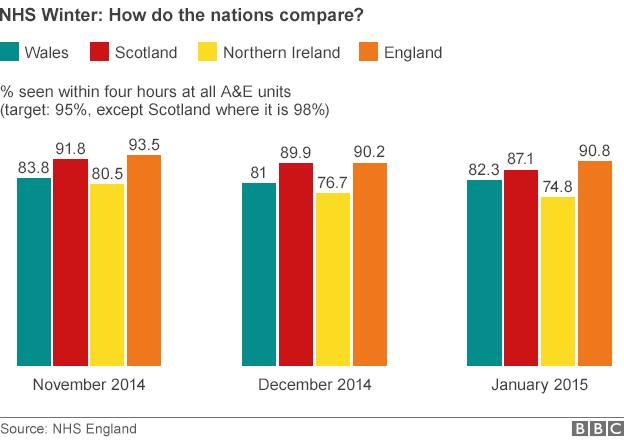
In January waiting times reached their worst levels in Wales since the current way of recording performance was introduced in 2009.
It got so bad that one police force reported it had had to start taking people to hospital because there weren't enough ambulances.

The problems have spread
Of course, A&Es do not work in isolation and so, unsurprisingly, other parts of the hospital system have experienced problems.
This graphic explains where the pressure points are.

1. Patients: Most patients arrive themselves, either after referrals by GPs or the NHS 111 helpline or under their own steam.
2. Ambulances: At busy times crews face delays handing over patients. Queues can develop keeping them from returning to the road.
3. Trolley waits: Patients who need to be admitted can face long waits - more than four hours or even 12 hours - before a hospital bed can be found.
4. Delayed discharge: Some need support in the community before they can be released. If this is not in place, they cannot leave hospital and so continue to take up a bed.
Read more: How hospitals have reached gridlock
Analysis by the House of Commons Library shows how such pressure points got worse this winter between November and March.

What has caused the difficulties?
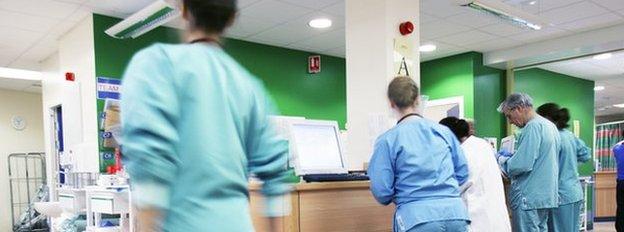
The simple answer is the number of people coming to A&E has gone up. Take a look at these figures.
Between November and February just over 7m visits were made to A&Es in England - 190,000 more than the year before.
The busiest week - the one ending 21 December - saw 446,000 people arrive, up by nearly 10% on the same week the year before and the highest ever recorded.
There were 1.82m emergency admissions - the most complicated cases that cannot be dealt with by A&E - up 51,000 on last year.
But this winter there has also been heated debate about what other factors may have played a role. These have ranged from the new 111 urgent phone service not being as good as it should to problems accessing social care and GPs.
Read more: Six reasons A&Es are struggling

It's not over yet...
The BBC may be ending its winter project, but that doesn't mean the pressures are over for the NHS. With Easter on the horizon, it is worth noting that two years ago pressures that Easter were almost as bad as they have been this winter.
Last spring and summer were also difficult, with the target being missed several times in England.
What is more, Scotland, Northern Ireland and Wales are all still a long way from achieving the target. The A&E story is unlikely to go away just yet.


Graphics produced by Nassos Stylianou and Charlotte Thornton